TL;DR — Quick Summary
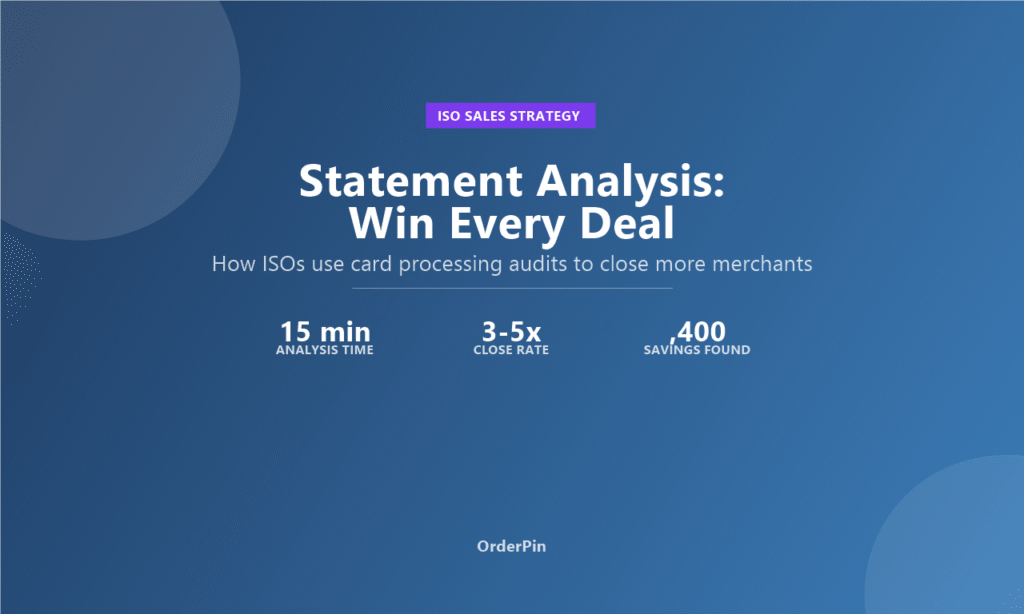
- Card processing statement analysis is the most effective door-opening tool for ISOs — it takes 15 minutes to uncover $2,000–$15,000/year in overcharges for the average small merchant.
- The five key metrics to extract from any statement: effective rate, per-transaction fee, qualified rate spread, card mix, and highest-cost card categories — each reveals a savings opportunity.
- ISOs who offer free statement analysis close deals at 3–5x the rate of those who cold pitch features, because they demonstrate concrete financial value before asking for the sale.
Last updated: April 2026
What Is Card Processing Statement Analysis?
Card processing statement analysis is the practice of reviewing a merchant’s monthly payment processing statement to identify overcharges, inefficient pricing structures, and savings opportunities. For ISOs and MSPs, it is the single most powerful sales tool in your arsenal — and the most underutilized.
The concept is simple: merchants are almost always paying more than they should because they were sold a confusing pricing structure and never properly analyzed. According to Value Quotient, a payment technology firm that has analyzed thousands of merchant statements, the average small business overpays by $2,000–$8,000 per year in unnecessary processing fees. High-volume merchants can easily overpay by $15,000–$30,000 annually.
The ISO who walks into a sales call with a printed analysis — showing exactly where the merchant’s money is going and how much they can save — has already won the sale before the pitch begins. This guide teaches you exactly how to do that, step by step.
What Information to Extract from Any Statement
Before you can analyze a statement, you need to know where to look. Here are the five key data points to extract from every merchant processing statement:
1. Total Processing Volume and Gross Revenue
The statement should show total monthly card volume (number of transactions and dollar amount) and gross revenue (total fees collected by the processor). These two numbers give you the baseline for everything else.
2. Effective Rate (Most Important Number)
Effective rate is the total fees divided by total volume. For example, if a merchant processes $100,000 and pays $3,200 in fees, their effective rate is 3.20%. Compare this to the base interchange rates for the card types being processed:
- Swiped Visa Debit: ~1.55% + $0.10 (baseline for comparison)
- Swiped Visa Consumer Credit: ~1.55%–1.95% depending on card type
- Keyed transactions: Typically 0.50%–1.00% higher than swiped
If the effective rate is significantly above the expected range (e.g., over 2.50% for a restaurant with mostly swiped transactions), there is clearly bloat in the pricing. The merchant is overpaying.
3. Per-Transaction Fee (Dollars per Transaction)
Divide the total fees by the number of transactions to get the average fee per transaction. This is a powerful comparison tool. A merchant processing 1,000 transactions at $100 average ticket ($100,000 volume) paying $3,200 in fees has an effective rate of 3.20% and an average fee of $3.20 per transaction. The baseline cost (interchange + network fee) for a typical Visa swiped transaction is approximately $1.65 + $0.10 = $1.75. Anything above $2.50 per transaction for this volume level suggests significant markup.
4. Qualified Rate Spread (Tiered Pricing Red Flag)
If the statement shows Qualified, Mid-Qualified, and Non-Qualified rates, look at the spread between them. A large spread (e.g., 1.79% Qualified / 2.79% Mid-Qualified / 3.79% Non-Qualified) is a major red flag — it means the merchant is likely being penalized heavily for processing rewards cards and business cards, which represent an increasingly large share of all transactions. The larger the spread, the more the merchant is overpaying.
5. Card Mix and Highest-Cost Categories
Many statements include a breakdown by card type. Look for:
- Keyed vs. swiped ratio: Keyed transactions carry higher interchange fees. If more than 20% of volume is keyed, this is a red flag — staff may not be trained to process EMV correctly.
- Amex volume: American Express charges significantly higher interchange fees than Visa/Mastercard. Merchants accepting Amex often pay 0.50%–1.00% more for these transactions.
- Premium/rewards card percentage: High-rewards credit cards (Visa Signature, World Elite Mastercard) carry 0.50%–1.00% higher interchange than basic cards.
The Step-by-Step Statement Analysis Process
Here is the exact workflow for analyzing a merchant’s statement in 15 minutes or less:
Step 1: Ask for the Statement (The Right Way)
Never say “can I see your processing statement?” — say: “I offer a free card processing audit for merchants in [their industry]. We look at your statement for 15 minutes and show you exactly where you are overpaying. No obligation. Would you like to schedule a 20-minute call?”
This framing does three things: it establishes value (free audit), sets expectations (15 minutes), and creates urgency (you want to schedule a call, not just send an email).
Step 2: Extract the Five Numbers (5 Minutes)
When you receive the statement, extract the five numbers in this order:
- Monthly volume (total $ processed)
- Total fees charged
- Effective rate (fees ÷ volume)
- Number of transactions
- Average fee per transaction (total fees ÷ transaction count)
Step 3: Calculate the Savings Opportunity (5 Minutes)
Using the baseline interchange rates above, calculate what the merchant should be paying under an Interchange Plus model:
- Baseline estimate: 1.80% average effective rate under Interchange Plus (accounting for card mix)
- Your markup: +0.15%
- Target rate for merchant: ~1.95%–2.10% effective rate
Example: Merchant processes $100,000/month at 3.20% effective rate = $3,200/month in fees. At a 2.10% target rate, they would pay $2,100/month. Savings: $1,100/month or $13,200/year.
Step 4: Prepare the Presentation (5 Minutes)
Create a simple one-page summary with:
- Current effective rate (what they are paying now)
- Target effective rate (what they should be paying)
- Monthly savings
- Annual savings
- One key insight (e.g., “You are paying 3.29% on Mastercard World Elite transactions — the baseline cost is 2.10%”)
Step 5: Deliver the Analysis (The Meeting)
Open the meeting by showing the numbers — not your product. Say: “Before we talk about what we offer, I want to show you what you are currently paying. Based on your statement, you processed [X] last month and paid [Y] in fees. Here is what that breaks down to per transaction. I found three specific areas where you are likely overpaying.”
Then walk through your three key findings. End with: “If we can save you $X per month with better pricing and no disruption to your business, would you be interested in learning more?” By this point, the merchant has already said yes to the concept of switching — your job is just to close the logistics.
The Three Most Common Overcharges Found in Statement Analysis
The Three Red Flags Every Statement Analysis Finds
How to Present the Analysis Without Sounding Like a Pitch
The biggest mistake ISOs make when presenting statement analysis is turning it into a sales pitch. The goal is to educate, not sell. Here is the correct approach:
- Do: Show the numbers first. Let the merchant draw their own conclusions.
- Do: Use their industry context. “Restaurants typically see the biggest savings because you process a lot of keyed transactions and rewards cards.”
- Do: Be specific about what you found. “Your Amex transactions are costing you 3.29% — Amex’s base rate is 2.95%, which means your processor is adding 34 basis points.”
- Do NOT: Lead with “we can save you money.” Lead with “here is what you are paying now.”
- Do NOT: Criticize their current processor by name unless they ask.
- Do NOT: Promise exact savings until you have run a full Interchange Plus quote.
How OrderPin Supports ISO Sales Partners
OrderPin’s white-label POS platform is built to help ISO partners win merchant deals with statement analysis. Our merchant dashboard includes built-in transaction analytics that break down card types, effective rates, and per-transaction costs — making it easy to pull the data you need for analysis, and to demonstrate ongoing value after the merchant is onboarded.
Why ISO Partners Choose OrderPin
Frequently Asked Questions
How long does a card processing statement analysis take?
A complete statement analysis takes approximately 15 minutes for an experienced ISO. The process involves extracting five key numbers from the statement (volume, fees, effective rate, transaction count, and per-transaction fee), calculating baseline costs under Interchange Plus pricing, and presenting the savings opportunity in a clear one-page format.
What is a good effective rate for credit card processing?
For most merchants under Interchange Plus pricing, a good effective rate is between 1.85% and 2.25%, depending on card mix. Merchants with primarily swiped debit cards can achieve rates as low as 1.55%–1.75%. Merchants processing many keyed transactions, Amex cards, or premium rewards cards typically see effective rates of 2.25%–2.75%. If a merchant’s effective rate exceeds 2.75% under Interchange Plus, there is likely a pricing or hardware issue that needs investigation.
What are the three tiers in Tiered pricing?
The three tiers in Tiered pricing are: (1) Qualified Rate (Q) — the lowest tier, typically for swiped debit and basic credit cards at 1.5%–1.9%; (2) Mid-Qualified Rate (MQ) — for rewards credit cards and business cards, typically 2.0%–2.5%; and (3) Non-Qualified Rate (NQ) — the highest tier for premium cards, corporate cards, and keyed transactions, reaching 3.0%–3.5% or higher.
How do ISOs make money from statement analysis?
ISOs make money by converting analyzed merchants to their white-label POS platform with competitive Interchange Plus pricing. The ISO retains the markup between the wholesale interchange rate and the merchant rate. For example, if the ISO sets a merchant at 2.10% effective rate and the actual interchange average is 1.75%, the ISO earns approximately 0.35% on every transaction — plus monthly fees, hardware margins, and value-added service revenue.
What is the most common overcharge found in card processing statements?
The most common overcharge is the Tiered pricing penalty on premium and rewards credit cards. As consumers have shifted to cash-back and travel rewards credit cards (which now represent over 60% of general purpose cards in circulation), merchants on Tiered pricing are paying Non-Qualified or Mid-Qualified rates on the majority of their transactions — often 0.5%–1.5% above the actual cost of those specific card types. The second most common overcharge is hidden monthly fees: PCI compliance fees, network access fees, and statement fees that are often not prominently displayed in the rate summary.
Conclusion
Card processing statement analysis is not just a sales tool — it is a trust-building exercise that positions you as a financial advisor rather than a vendor. The ISO who offers free analysis, presents specific findings, and delivers a concrete savings number will close more deals, earn higher merchant loyalty, and generate more referrals than the ISO who walks in with a product brochure.
The process is not complicated: ask for the statement, extract five numbers, calculate the gap, present the findings, and close. Fifteen minutes of analysis can save a merchant $2,000–$15,000 per year — and generate $1,000–$5,000 in first-year ISO revenue for every merchant converted.
About OrderPin
OrderPin is a white-label POS platform built for ISO and MSP partners. We offer full data ownership, transparent Interchange Plus pricing, and built-in analytics to help you analyze merchant portfolios, identify savings opportunities, and close more deals under your own brand.
Learn more about OrderPin’s white-label solution