
TL;DR — Quick Summary
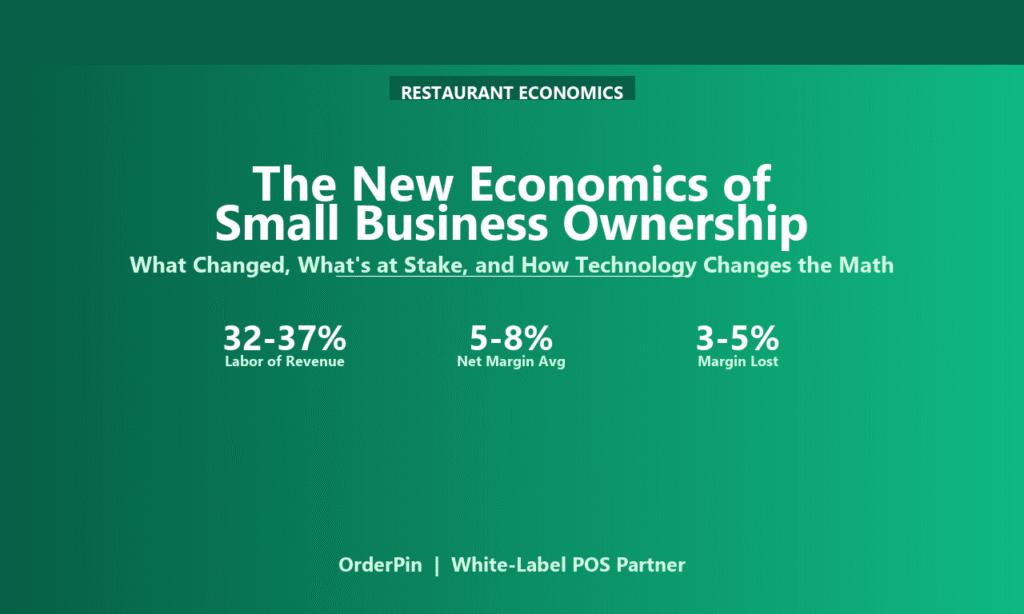
- Restaurant economics have shifted: labor now consumes 32–37% of revenue on average, and margins have compressed to levels that make intuition-led management dangerous.
- Technology is no longer optional. Restaurants without digital ordering, automated inventory, and real-time reporting are losing 3–5% more in margin than their technology-enabled peers.
- For ISOs, the new economics are the strongest sales argument available — because the cost of not acting is measurable, immediate, and growing.
The math of running a restaurant has changed. Twenty years ago, a 15% labor cost and 30% food cost left a comfortable margin for error. Today, 32–37% labor, 28–33% food cost, and 5–8% net margins mean the restaurant that runs on gut feel is bleeding money it doesn’t even know it’s losing.
This is not a story about macroeconomics — inflation, minimum wage, food prices. It’s a story about the owners who understand the new math and the owners who don’t. And for ISOs, that gap is the most important commercial reality in the market today.
The New Economics: What Actually Changed
The fundamental shift is in the cost structure. Three forces have compressed margins simultaneously:
| Force | What It Did to Margins | What Successful Operators Do |
|---|---|---|
| Labor cost escalation | Up from 25–30% of revenue 10 years ago to 32–37% today; tight labor markets make this structural | Data-driven scheduling, labor % targets by day part, automation for repetitive tasks |
| Consumer price sensitivity | Raising prices to offset costs drives away price-sensitive customers; margins can’t simply pass through | Menu engineering to protect margins; digital channels to reduce service labor costs |
| Third-party delivery fees | 25–30% in commission fees on delivery orders; many restaurants break even or lose money on delivery | Direct ordering channels (QR, website, app) to avoid commission; use delivery as a supplement, not the model |
| Technology arms race | Competitors with POS analytics, digital ordering, and automated inventory are pulling ahead; the gap widens quarterly | Treat technology as a competitive necessity, not a cost center |
The 3–5% Margin Gap: Where Technology Saves It
On a $1.5M restaurant, 3–5% of revenue is $45,000–$75,000 per year. Here’s where it comes from without technology:
- Labor overstaffing ($20,000–$35,000/year): Owners who don’t track labor % daily typically run 1–2% over their target. On $1.5M with 33% labor target, that’s $15,000–$30,000 in annual overspend. Data-driven scheduling brings this to target.
- Food cost waste ($10,000–$20,000/year): Without integrated inventory and daily usage tracking, food cost runs 2–4% above target. Accurate ordering and portion control recovers most of this.
- Delivery commission waste ($8,000–$15,000/year): Restaurants that route 30–40% of delivery through third-party platforms pay 25–30% commission on revenue that barely covers costs. Direct ordering (QR, website) eliminates this.
- Theft and error ($5,000–$12,000/year): Void tracking, digital drawer reconciliation, and POS-integrated employee management typically recover $5,000–$12,000/year for a mid-size restaurant.
The Technology vs. No-Technology Comparison
- Labor: 34–37% of revenue
- Food cost: 31–35%
- Net margin: 3–5%
- Decision cycle: weekly or monthly
- Knows problems 2–4 weeks late
- Delivery commission on 30–40% of orders
- Labor: 28–32% of revenue
- Food cost: 28–31%
- Net margin: 8–12%
- Decision cycle: daily
- Problems caught within 24 hours
- Direct ordering on 40–60% of orders
How ISOs Should Use the Economics in Sales
The new restaurant economics give ISOs the most powerful sales framework available — because it’s a math problem, not a philosophy. Show the owner their current margin and what it should be, and let the numbers make the decision:
| Conversation | The Math | ISO’s Ask |
|---|---|---|
| Labor audit | 1% over target on $1.5M = $15,000/year lost | POS with daily labor % tracking + data-driven scheduling |
| Food cost analysis | 2% over food cost target on $1.5M = $30,000/year | Integrated inventory management |
| Direct ordering | Moving 20% of delivery to direct saves $7,500–$12,000/year in commissions | QR ordering, website ordering, loyalty program |
| Drawer & theft protection | $7,500/year average recovery | Digital reconciliation, void tracking, employee management |
Frequently Asked Questions
1. Is a 5–8% net margin really the industry average?
Yes — and it’s been trending down over the past decade. Restaurants that maintain 10–15% net margins have all adopted technology-enabled operations. The ones at 3–5% are running on gut feel and don’t know how far behind they are.
2. Doesn’t technology cost money too?
Yes — and the math needs to be run properly. A POS at $150/month + inventory add-on at $50/month + direct ordering at $30/month = $2,760/year. If it recovers 1% of labor ($15,000/year on a $1.5M restaurant), the ROI is positive by a factor of 5. The technology cost is almost never the problem.
3. What about the restaurant doing $500K — is technology worth it?
Yes — the margin gap between technology-enabled and intuition-led operators is proportional to revenue. On $500K, the gap is smaller ($22,500–$37,500/year) but the technology cost is also proportionally lower. Start with the basics: POS with daily labor tracking and digital ordering.
4. How do I bring up economics with a merchant who thinks they’re doing fine?
Ask one question: “What’s your labor as a percentage of sales right now?” If they don’t know, the gap is larger than they think. If they do know and it’s above 33%, the conversation writes itself.
5. Is third-party delivery really that damaging to margins?
For many restaurants, yes. A $30 delivery order at 30% commission costs $9. After food cost ($10), the restaurant has -$1 before covering labor or overhead. The strategic play: use delivery platforms to reach new customers, then migrate them to direct ordering where the margin is preserved.
The ISO’s Edge: Make the Math the Salesman
OrderPin is a restaurant POS software ISV specializing in omni-channel ordering, all-in-one POS solutions, and full integrations with payment processors, payroll systems, and delivery platforms. For ISOs and MSP partners, the new restaurant economics are the opening — because for every merchant who runs on gut feel, there is a $45,000–$75,000/year opportunity sitting right there.
The restaurants that survive the next decade are not the ones with the best food or the best location — they’re the ones that understand their economics and act on them in real time. Help your merchants run the math, and you’ll never compete on price again.