
TL;DR — Quick Summary
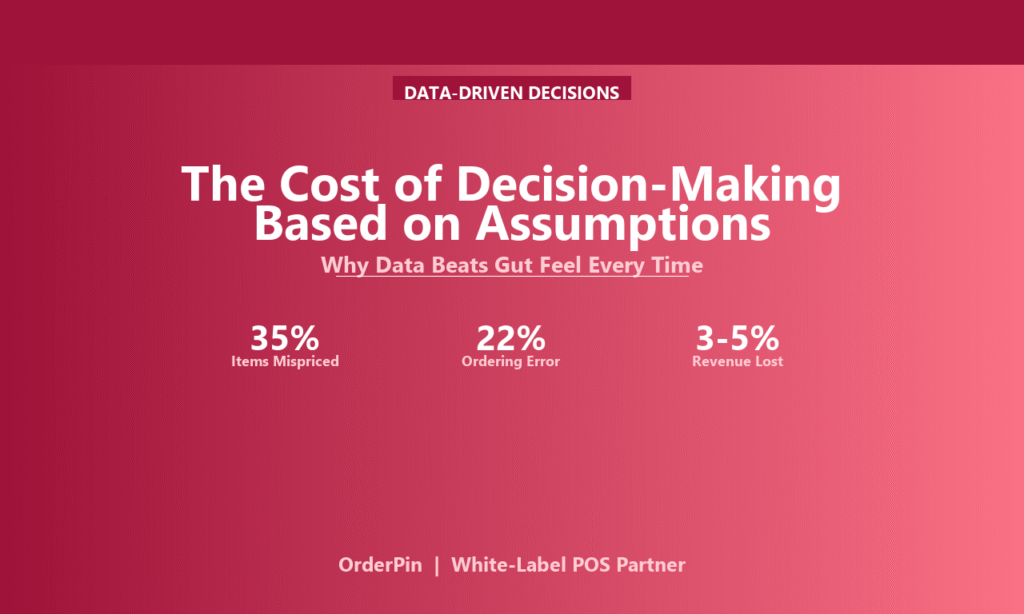
- Restaurant operators who make decisions based on experience and intuition are pricing menu items wrong up to 35% of the time and over-ordering inventory at a 22% error rate — every single month.
- The cost of assumption-based decisions is not abstract: misplaced orders, overstaffed shifts, mispriced items, and wasted inventory add up to 3–5% of revenue leaking away annually without the owner ever knowing.
- For ISOs, the assumption-gap conversation is the most direct path to a value-based sale — because it ties every POS feature to a specific dollar amount the merchant is currently losing.
Ask a restaurant owner why they priced a menu item the way they did. The answer is usually some version of: “It felt right.” Or “That’s what everyone else charges.” Or “I’ve been doing it this way for twenty years.”
Now ask them: what’s that item’s food cost percentage? What’s its margin per plate? How many do you sell per week? What’s the customer rating? Nine times out of ten, the answers get vaguer. And that’s the problem — when assumptions drive the big decisions, the math quietly bleeds away.
What “Assumption-Based” Decisions Actually Cost
The damage from assumption-based decisions falls into four predictable categories. Every one of them has a data answer:
| Decision Area | The Assumption | The Reality | Annual Cost |
|---|---|---|---|
| Menu pricing | “I priced it based on what feels right” | Up to 35% of items priced below optimal margin | $8K–$15K/year |
| Inventory ordering | “I order what we usually need” | 22% over or under actual need; spoilage or stockouts | $10K–$20K/year |
| Staff scheduling | “I schedule what feels right for Friday nights” | Data shows actual traffic vs. assumed; 1–2% labor overrun | $15K–$30K/year |
| Menu engineering | “That item is popular, I should keep it” | High sales ≠ high margin; low-margin items consume kitchen capacity | $5K–$12K/year |
The 35% Menu Pricing Problem: A Case Study
Consider a mid-size restaurant with 25 menu items. Research shows that 35% of items in restaurants without data-driven pricing are priced below their optimal margin point — meaning the restaurant is leaving money on the table by not charging enough for what costs the most to produce.
Here’s the typical scenario: a pasta dish with a food cost of $4.50 is priced at $13.95 because “that’s what pasta goes for.” A data analysis reveals the dish actually costs $5.10 to produce (portion creep, rising cheese costs) and the margin should be $15.95. At 80 covers per week, that’s $82/week in lost margin — $4,264/year for one item. Multiply by 8–9 underpriced items, and the assumption problem costs $30,000–$40,000/year.
How ISOs Can Start the Assumption Conversation
The assumption-gap conversation is not a lecture. It’s a discovery process. Ask the owner about one specific decision — and then ask what data they used to make it. Every merchant will discover the same thing: they used memory, feel, and experience, not numbers:
| Question to Ask | What It Reveals | Data Answer |
|---|---|---|
| “What’s your food cost percentage right now?” | Assumption vs. reality gap | POS tracks food cost per item daily |
| “Which menu item makes you the most money?” | Usually wrong — popularity ≠ profitability | Margin per item per week from POS data |
| “What’s your labor % on a busy Saturday?” | Usually underestimated by 1–2% | Labor % by day part, by hour from POS |
| “How much do you typically over-order per week?” | Most owners don’t track this at all | Integrated inventory with par-level alerts |
Frequently Asked Questions
1. Is the 35% mispricing statistic real?
Restaurant analytics studies consistently find that restaurants without data-driven menu engineering misprice 30–40% of items — most often underpricing high-cost items and overpricing low-cost items. The margin impact is real: a 1% food cost improvement on a $1.5M restaurant is $15,000/year.
2. Don’t owners already know their numbers — they just don’t have time?
Most don’t — and the ones who do often have outdated or approximate numbers. The POS that generates the data automatically and formats it into a daily summary solves the time problem. The owner doesn’t need to build reports; they need to read three numbers.
3. How do you get an owner to admit they’re running on assumptions?
Don’t ask them to admit anything. Ask them to calculate one number: their food cost percentage, right now, without checking. Then ask what data source they used to know that. The gap between “what I think it is” and “what it actually is” is the moment the conversation changes.
4. Can’t owners just use a spreadsheet instead of a POS?
Spreadsheets capture data that someone manually enters. POS data is captured at the point of sale, automatically, in real time. The difference is accuracy (no manual entry errors), speed (daily vs. weekly), and coverage (every item, every transaction, every shift). Spreadsheets are a bridge; POS is the destination.
5. What’s the fastest way to show an owner the value of POS data?
Pull their own sales data for the past 4 weeks and build a menu profitability analysis — sales volume vs. food cost per item. The results are always a mix of surprises: bestsellers that barely contribute margin, and quiet items that carry the P&L. Once they see it, they’ll never want to run a menu without it again.
The ISO’s Edge: Replace Assumptions with Answers
OrderPin is a restaurant POS software ISV specializing in omni-channel ordering, all-in-one POS solutions, and full integrations with payment processors, payroll systems, and delivery platforms. For ISOs and MSP partners, the assumption-gap conversation is the opening — because every merchant who makes decisions without data is leaking 3–5% of their revenue, and they just don’t know it yet.
The most dangerous decision a restaurant owner makes is the one they’re most confident about — because they’ve always done it that way. Help your merchants see the gap between assumption and reality, and the POS sale will make itself.