
TL;DR — Quick Summary
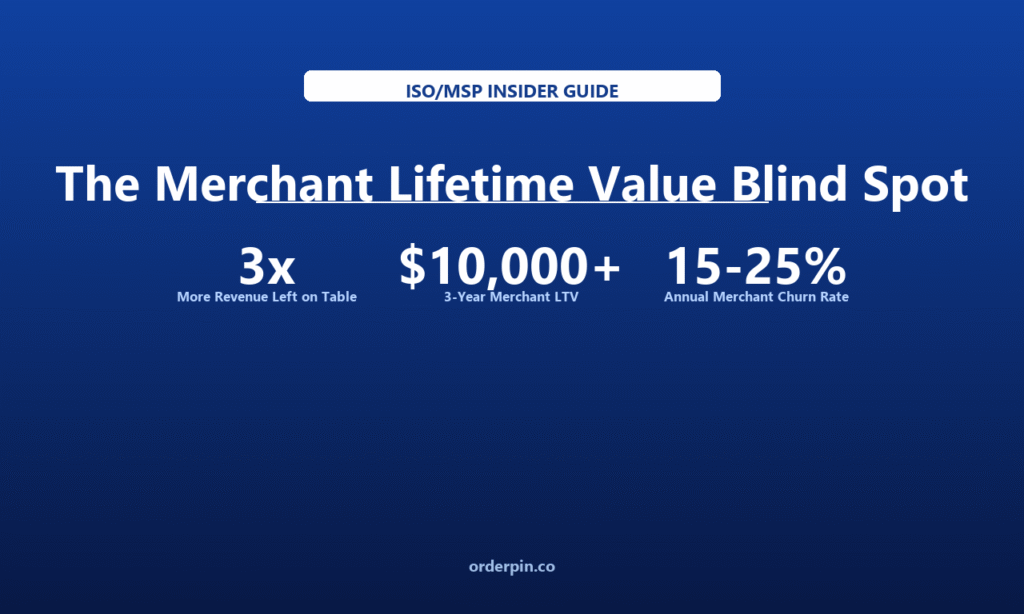
- Most ISOs don’t track Merchant LTV: Industry data shows fewer than 20% of ISOs have a formal system to measure what a merchant is worth over 3–5 years, yet average 3-year LTV exceeds $10,000 per merchant.
- The gap is 3x — literally: When ISOs calculate true LTV including upsell, cross-sell, and adjacent services, the actual lifetime value is typically 3x what they use in pricing decisions, leading to chronic underpricing.
- Building an LTV framework changes retention strategy: ISOs who know their true LTV invest smarter in customer success, onboard faster, and price with confidence — because they know exactly how much a lost merchant actually costs.
On the Table
Merchant LTV
Churn Rate
What Is the Merchant LTV Blind Spot — and Why Does It Exist?
Ask an ISO how much it costs to acquire a new merchant, and most can give you a rough answer. Ask them what that merchant is worth over three years — including upsells, adjacent services, referral revenue, and the compounding value of a retained account — and you’ll get a long pause.
This isn’t negligence. It’s a structural blind spot built into how the ISO business model evolved. Processing revenue is easy to measure — it’s the monthly residual check. The full picture of a merchant’s value is harder to see because it spans multiple revenue streams, multiple years, and multiple dimensions of business health that don’t show up on a processing statement.
The result is that most ISOs make three critical decisions — how much to invest in onboarding, how to price their services, and how aggressively to pursue retention — using a number that is only one-third of the true picture. That’s not a small error. At scale, it’s the difference between a business that grows and a business that slowly bleeds.
vs. Perceived LTV
Merchant LTV
Attrition Rate
LTV Tracking
1. What ISOs Actually Measure — and Why It’s Wrong
The standard ISO calculation looks something like this: a merchant does $50,000 in monthly processing volume, the ISO earns 0.15% (15 basis points), so the monthly residual is $75. Over 12 months, that’s $900. Over 36 months, that’s $2,700. That’s the merchant’s value — right?
Wrong. That’s the processing-only revenue from a single product line. The true merchant lifetime value includes several additional dimensions that most ISOs never factor in.
Upsell revenue: Merchants who renew and expand their processing volume over time. A restaurant that starts at $50K/month and grows to $80K/month by year three generates 60% more revenue than the baseline calculation predicted.
Adjacent services: POS hardware, software subscriptions, loyalty programs, delivery integrations, analytics tools. Each adds a separate revenue stream attached to the same merchant relationship.
Referral value: Satisfied merchants refer other merchants. A single restaurant owner who introduces you to two peers in their first year effectively pays for your acquisition cost multiple times over.
Recovery cost avoidance: Every merchant retained is one you don’t have to replace. Given that merchant acquisition costs range from $1,500 to $5,000 per merchant (depending on sales model), retention literally saves you the cost of replacement.
2. The Real Cost of Merchant Churn
The payments industry average merchant churn rate is 15–25% annually — meaning that a typical ISO with 500 merchants will lose between 75 and 125 of them every year. For most ISOs, that’s an accepted fact of the business. What they don’t measure is what that churn actually costs them.
The true cost of a lost merchant includes three components that compound on each other:
Direct revenue loss: A merchant generating $75/month in residuals who churns costs $900/year, $2,700 over three years. That’s the easy number.
Replacement cost: Replacing that merchant requires $1,500–$5,000 in sales investment (depending on whether you use agents, digital marketing, or direct outreach). That acquisition cost comes directly off your profit.
Streak multiplier: Churn begets churn. A merchant who left because of poor service or a better competitor offer often tells their peers. Each churned merchant who refers their friends to a competitor costs more than their direct revenue loss.
ISOs Who Track LTV vs. ISOs Who Don’t
| Metric | No LTV Tracking | LTV-Tracking ISO | Advantage |
|---|---|---|---|
| Perceived Merchant Value | $2,700 (3-yr processing) | $10,000+ (3-yr full LTV) | LTV ISO: 3x |
| Onboarding Investment | Minimal (perceived low value) | $500–$2,000 (ROI justified) | LTV ISO: better merchant health |
| Churn Rate | 18–25% annual | 8–12% annual | LTV ISO: 2x better retention |
| Pricing Confidence | Low (leaves money on table) | High (knows true value) | LTV ISO: better margins |
| Upsell Revenue per Merchant | Minimal | $2,000–$5,000/yr avg. | LTV ISO: 3–5x more |
3. Building a Real LTV Framework for Your ISO
A useful merchant LTV calculation doesn’t need to be perfectly precise — it needs to be directionally accurate and consistently applied. Here’s the framework that leading ISOs use to move from guesswork to data-driven decisions.
The Five-Component LTV Formula:
1. Base Processing Revenue: Monthly residual × 12 months × expected merchant lifespan. Use your actual average merchant lifespan (in months) from your portfolio data, not an industry average. Most ISOs find their actual lifespan is shorter than they think.
2. Upsell Revenue: Estimate what percentage of merchants upgrade their volume or add services each year. Conservative assumption: 30% of merchants add one additional product or service in years 2 and 3. Use your actual portfolio data where available.
3. Referral Credit: Track referral conversions. If 10% of new merchants come from referrals, attribute 10% of your acquisition cost savings to your existing base. This is real economic value that belongs in the LTV calculation.
4. Retention Savings: Every retained merchant saves you the cost of replacing them. Calculate: annual churn count × replacement cost. This is the “avoided cost” that makes retention investment visible.
5. Confidence Discount: Apply a discount rate to account for uncertainty. Most advisors use 10–15% to reflect the risk that a merchant churns earlier than expected. This makes the number conservative and defensible.
How OrderPin Helps ISOs Build LTV-Driven Merchant Relationships
OrderPin is a restaurant POS software ISV that gives ISOs the platform depth needed to build genuine merchant LTV. With full data visibility, upsell-eligible software modules, and multi-location management, OrderPin helps ISOs increase merchant lifespan, grow wallet share, and make their LTV investments visible.
- Full data ownership: ISOs own all merchant transaction and operational data — the foundation for calculating and growing true LTV.
- Upsell-eligible modules: Loyalty, delivery integration, analytics, and scheduling tools create natural expansion revenue within the same platform.
- Multi-location management: Single-merchant LTV grows 3–5x when a merchant expands. OrderPin’s multi-location tools support that growth and capture that value.
- No long-term lock-in: ISOs maintain full ownership of their merchant relationships and data, regardless of the technology roadmap.
4. Three Retention Investments That LTV Math Justifies
Once ISOs see the real LTV number, the question becomes: what do you do with it? The answer is that certain retention investments that looked too expensive under the old calculation suddenly become obviously profitable under an LTV framework.
Dedicated account management for high-value merchants: If a merchant’s 3-year LTV is $10,000, spending $500–$1,000/year on proactive account management is a 10–20% investment in that LTV — with a guaranteed ROI if it reduces churn probability by even 5–10%.
Technology onboarding acceleration: Merchants who actively use their POS reporting tools churn at roughly half the rate of merchants who never log in. Investing in onboarding — training, configuration, first-month check-ins — has a measurable impact on merchant activation rates and, therefore, retention.
Quarterly business reviews with merchants: A 30-minute quarterly call to review a merchant’s sales trends, peak periods, and technology adoption is low-cost for the ISO and high-value for the merchant. It surfaces upsell opportunities, catches dissatisfaction early, and builds the relationship depth that makes switching costly.
5. Making LTV Your Competitive Advantage
The ISOs who will build the most defensible businesses over the next five years are the ones who shift from selling transactions to managing merchant value. That shift requires a different internal vocabulary, different metrics, and different investment decisions — all anchored in a real understanding of LTV.
The practical changes are more straightforward than they might sound. Start by building an LTV estimate for your top three merchant archetypes — your high-volume accounts, your mid-market restaurants, and your SMB baseline. Even rough numbers will change how you think about pricing, onboarding, and retention. Then build one new process: a 90-day check-in with every new merchant, measured by technology activation rate, not just processing volume.
Industry data on SaaS and subscription business models — which share structural similarities with ISO merchant relationships — consistently shows that businesses that actively measure and manage customer LTV outperform those that don’t by 2–3x on retention and 40–60% on upsell revenue per customer.
Frequently Asked Questions
Why do most ISOs underestimate merchant LTV?
Most ISOs only count processing residuals when calculating merchant value. They miss upsell revenue, cross-sell from adjacent services, referral value, and the avoided cost of not having to replace a churned merchant. When all five components are included, true 3-year LTV is typically 3x what ISOs use in their calculations.
What’s a realistic merchant LTV for a restaurant ISO?
For a mid-market restaurant doing $50,000–$100,000/month in processing volume, a realistic 3-year LTV including processing residuals, software subscriptions, and one adjacent service (loyalty, delivery integration) is $10,000–$18,000. High-volume accounts with full software adoption can reach $25,000–$40,000 over five years. These numbers are directionally consistent with what leading ISOs report from their own portfolio data.
How does LTV change how an ISO should price their services?
Knowing true LTV allows an ISO to price with confidence. If a merchant is worth $10,000 over three years, the ISO can afford to invest up to $3,000–$4,000 in acquiring and onboarding that merchant and still earn a strong return. This makes bundled pricing, onboarding services, and annual contracts economically viable — even if they feel risky under a processing-only calculation.
What’s the single highest-impact retention investment for ISOs?
The 90-day post-onboarding check-in is consistently the highest-ROI retention investment ISOs can make. Merchants who are actively using their POS reporting tools by day 90 churn at roughly half the rate of those who never log in. A structured onboarding that includes a “day 30 setup call” and “day 90 health review” dramatically improves activation rates and merchant satisfaction.
How do I calculate my ISO’s average merchant LTV with limited data?
Start with what you have: average monthly residual per merchant, average annual churn rate, and average number of services per merchant. Even a rough three-year calculation using these three numbers will be dramatically more useful than not calculating at all. Build your data sophistication over time — the first number you calculate is always more valuable than the perfect number you never build.
The merchant LTV blind spot isn’t just an analytical problem — it’s a strategic problem that costs ISOs real money every year. ISOs who measure true merchant lifetime value make better decisions about pricing, onboarding investment, and retention. They know when to spend $1,000 on a customer success call (almost always, if the merchant’s LTV is $10,000+). They price bundled services with confidence. And they build businesses that compound in value rather than slowly bleeding through preventable churn. The first step is calculating the number — even approximately. Everything else follows from that. OrderPin is a restaurant POS software ISV built to help ISOs increase merchant LTV through deeper platform adoption, full data ownership, and upsell-ready software modules that make merchants stickier over time.
About OrderPin
OrderPin is a white-label POS platform built for ISO and MSP partners. We offer full data ownership, flexible pricing, and seamless API integrations to help you build a recurring revenue business under your own brand. Learn more about OrderPin’s white-label solution