
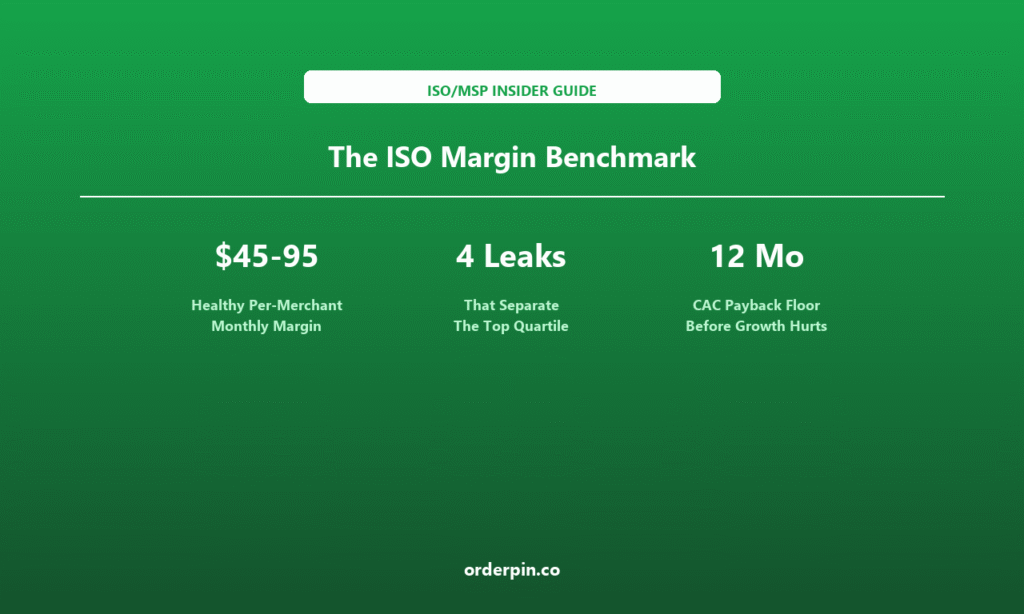
TL;DR — Quick Summary
- Portfolio margin hides everything that matters: “We run at 38%” is not a benchmark, it is an average that can hold steady while half your book quietly becomes unprofitable. The number to compare against the market is per-merchant monthly gross margin — one merchant, one month, before your own overhead.
- Healthy is a range, not a number: roughly $55–95 per merchant per month for a small-book, high-touch ISO, drifting toward $78–84 at scale as fixed cost is absorbed and mix shifts toward larger merchants. Below about $45 you are not running a business, you are running a subsidy.
- Four leaks, and only one of them shows up on a P&L: unrecovered device subsidy, unbilled support, concessions that never expire, and sub-scale merchants that cost more to serve than they earn. Fixing them is worth more than any new merchant you will sign this quarter.
Monthly Gross Margin
On The P&L
Before Growth Bites
The Problem Is Not Calculation, It Is Comparison
Almost every ISO can tell you its margin. Very few can tell you whether that margin is good. The calculation is arithmetic anyone can do; the comparison requires a reference point that the industry has never really published, because it is embarrassing to publish and easy to hide. So operators fall back on two substitutes that both mislead: a percentage of processing volume, which says nothing about fixed cost, and total portfolio profit, which grows whenever you add merchants regardless of whether any individual merchant is worth having.
This article supplies the missing reference point. It defines one number precisely, gives a range for it across portfolio size, vertical, and merchant tenure, ranks the four leaks that separate the top quartile from everyone else, and specifies the floor below which additional growth destroys value rather than creating it. Everything here is built to be used as a diagnostic on your own book, not read as market commentary.
One honesty note before the numbers: the ranges below are modeled — derived from publicly reported payment economics and portfolio arithmetic, not from a proprietary survey of thousands of ISOs. The methodology note at the end states the assumptions, the sample basis, and exactly which figures you should replace with your own measurements before quoting any of this. A benchmark you cannot trace is worse than no benchmark.
Not Per Dollar
Not Signing Bonus
Overhead
And Platform
1. Define the Number So It Cannot Be Gamed
The metric is NMGM — net merchant gross margin: all revenue attributable to one merchant in one month, minus every cost incurred to serve that merchant that month, before your own sales and administrative overhead. Revenue includes spread over interchange and assessments, monthly platform fees, software subscriptions, gateway and statement fees. Costs include processor and network cost, platform cost, hardware amortisation, and support time at a loaded rate.
Three exclusions you must hold firm on: no signing bonuses or upfront equipment sales counted as margin, no residual share paid to the agent netted out (that is a distribution cost, tracked separately), and no allocation of company overhead. The moment you include any of the three, the number stops being comparable across books and becomes a number only you can interpret — which defeats the purpose.
Compute it as a distribution, never an average: pull the last 90 days of merchant-level revenue and cost, calculate NMGM per merchant per month, then report P25, P50 and P75. The average is the least informative of the four statistics, because portfolio economics are shaped by the bottom quartile, not the middle.
Where a Book Lands: NMGM by Portfolio Size
Modeled monthly gross margin per merchant, USD. Bar = P25 to P75. Marker = median.
Median (P50)
Merchant count in portfolio →
2. The Benchmark Table
Three views on the same metric. Read them together, because the size view tells you what is achievable, the vertical view tells you what is normal for your mix, and the tenure view tells you where in a merchant’s life you actually are. A single merchant’s NMGM means nothing until you know all three coordinates.
View 1 — By Portfolio Size (USD per merchant per month)
| Portfolio | P25 | P50 | P75 | Characteristic of the book |
|---|---|---|---|---|
| Under 1,000 | $28 | $55 | $96 | High spread, high touch, widest dispersion |
| 1,000 – 5,000 | $38 | $68 | $112 | Mix starts to matter more than pricing |
| 5,000 – 20,000 | $46 | $78 | $124 | Fixed cost absorbed, software attach decides tier |
| 20,000 + | $52 | $84 | $130 | Narrow spread, thin bps, deep attach |
The median rises about 50% from sub-scale to national while the interquartile width narrows. That is not because big ISOs price better — it is because they have removed the bottom tail, which is the entire argument of this article.
View 2 — By Vertical (median NMGM, USD)
| Vertical | Typical Monthly Volume | Median NMGM | Why it sits here |
|---|---|---|---|
| Full-service restaurant | $20k – $45k | $68 | Wide spread survives, but support load is heavy |
| QSR / fast casual | $25k – $60k | $58 | High ticket count, thin per-transaction spread |
| Specialty retail | $18k – $55k | $74 | Balanced spread and ticket size, moderate support |
| Grocery / convenience | $60k – $180k | $96 | Very thin bps, but volume carries it |
| Professional services / B2B | $5k – $120k | $88 | Lowest support cost, widest variance of all |
| Lodging | $40k – $200k | $124 | Fewest merchants, highest revenue each, seasonal |
View 3 — By Merchant Tenure (share of steady-state NMGM)
Months since activation →
NMGM in the first year runs near 70% of steady state on average, and roughly half in the first quarter. Any benchmark comparison that ignores tenure will make a young book look catastrophically worse than it is — and a mature, churning book look better than it is.
3. The Four Leaks That Separate the Top Quartile
Top-quartile books do not have better pricing. In practice they are priced the same or worse, because they compete on something other than rate. What separates them is that four specific leaks are closed rather than tolerated — and three of the four never appear as a line item anywhere, which is exactly why they persist for years.
A terminal given free against a 24-month commitment is a loan, not a discount. When average merchant tenure is shorter than the payback period, every merchant that leaves early leaves with hardware you paid for. Typical drag: 8–18% of NMGM in books that subsidise aggressively and do not track recovery.
Support is almost never costed per merchant, so the 15% of merchants who consume 60% of the hours look profitable on paper. Loaded at even $25 per hour, a merchant with three calls a month has a support bill larger than its annual software fee. Typical drag: 15–25% on high-touch segments.
A discount given to win a competitive deal is meant to be temporary and almost never is. Because nobody diarises the reset, the concession becomes the new list price and resets the ceiling for every renewal behind it. Typical drift: 2–4% of NMGM per year, compounding quietly.
Below roughly $30 of NMGM a merchant cannot cover its own service cost. These accounts typically make up 20–30% of merchant count and contribute negative gross margin — yet they are counted as growth in every board deck, because nothing in the reporting distinguishes them from a profitable merchant.
Leak Severity by Portfolio Size
| Leak | Under 1k | 1k – 5k | 5k + | First fix |
|---|---|---|---|---|
| Device subsidy | Severe | Material | Managed | Track recovery per serial number against tenure |
| Unbilled support | Material | Severe | Severe | Cost tickets at loaded rate, per merchant |
| Concessions | Material | Material | Material | Diarise every concession with an expiry date |
| Sub-scale merchants | Severe | Material | Managed | Set a minimum viable merchant profile |
4. The Floor: Where Growth Starts Destroying Value
There is a level of NMGM below which adding merchants makes you poorer, and it is not a matter of opinion — it is arithmetic. Acquisition cost has to be recovered out of gross margin within the merchant’s expected life, discounted for the fact that the first year delivers roughly 70% of steady-state margin. Set that out plainly and the floor falls out of the equation.
The Floor Formula
NMGM floor = CAC ÷ (12 × first-year realisation)
With a first-year realisation factor of 0.70, the divisor is 8.4. At a $400 fully-loaded CAC — low-touch, agent-led, no hardware — the floor is about $48 per merchant per month. At $600 it is $71. At $900, typical of a direct, hardware-heavy, high-touch model, the floor is $107. Publish a merchant below your own floor and you have bought revenue at a loss, which is the one thing volume cannot fix.
CAC Payback at Three Cost Structures
| Model | Fully-loaded CAC | NMGM Floor | Payback at P50 | Verdict |
|---|---|---|---|---|
| Low-touch, partner-led | $400 | $48 | 8.7 months | Sustainable; scale the channel |
| Hybrid, some hardware | $600 | $71 | 13.1 months | Workable only with sub-$30 support cost |
| Direct, hardware-heavy | $900 | $107 | 19.6 months | Below floor for most SMB — needs software attach |
Payback computed against P50 NMGM of $55 with a 0.70 first-year realisation factor. The third row is why hardware-heavy ISOs chase software attach so hard: at $107 required, processing margin alone does not clear the floor.
5. How to Use This Table in One Afternoon
A benchmark that does not change a decision is entertainment. This sequence is deliberately short: three steps, one spreadsheet, no consultants.
Step 1 — Measure (90 minutes): Export 90 days of merchant-level revenue: spread, platform fees, software, gateway, statements. Export merchant-level cost: processor and network, platform, hardware amortisation, and support hours at a loaded rate. Join on merchant ID, divide by three, and you have NMGM per merchant per month for your entire book. If a cost cannot be allocated per merchant, that is the finding — it means it is not being managed per merchant.
Step 2 — Locate (30 minutes): Plot your P25, P50 and P75 against the size table. If your median is within $10 of the band for your portfolio size, you are normal and the opportunity is in dispersion, not the median. If your P25 is below $30, you have a bottom-tail problem, and the bottom tail is where most of your support hours, disputes, and churn live.
Step 3 — Act on the right end (next quarter): If the median is below the band, close leaks before hiring salespeople — leak recovery is worth more per unit of effort than acquisition, because it applies to merchants you already paid for. If the median is above the band but the P25 is below $30, stop acquiring the profile that produces the bottom tail, and set a minimum viable merchant definition. Only when the median is in band and the P25 is above the floor should growth spend increase.
How OrderPin Makes This Benchmark Computable
The reason most ISOs cannot answer “is our margin good?” is not analytical laziness — it is that merchant-level revenue and cost live in four different systems and one of them is a spreadsheet. OrderPin is a white-label POS platform built for ISO and MSP partners, and it keeps the inputs in one place.
- Merchant-level revenue in one model: processing spread, platform fees, and software subscriptions sit on the same merchant record, so NMGM is an export rather than a reconciliation project.
- Cost you can actually allocate: transaction and platform cost are attributable per merchant by design, which removes the allocation guesswork that makes most margin analyses unverifiable.
- Tenure and life-cycle visible by default: activation date, tenure band, and hardware deployment are part of the merchant record, so the first-year realisation penalty is measurable instead of assumed.
- Full data ownership: the dataset is yours, exportable, and yours to model — including the bottom-tail analysis that tells you which merchants are destroying margin.
Frequently Asked Questions
What is a good per-merchant margin for an ISO?
Around $55–95 per merchant per month of net gross margin for portfolios under 5,000 merchants, rising toward $78–84 at scale as fixed cost is absorbed and the bottom tail is removed. Below roughly $45 the merchant cannot reliably cover acquisition cost within a normal lifetime, and below $30 it cannot cover its own service cost. The number that matters most is not your median but your P25 — that is where the losses are concentrated.
Should I measure margin as a percentage of volume or in dollars per merchant?
Both, but they answer different questions. Basis points tell you whether your pricing is competitive in a deal. Dollars per merchant per month tells you whether the business works, because your costs are per merchant, not per dollar processed. An ISO running 40 bps on a book of very small merchants can be less profitable than one running 15 bps on a book of larger ones — the bps number cannot see that, and the per-merchant number can.
Why is first-year margin so much lower than steady state?
Four reasons compound: hardware subsidy is amortised across the commitment and often not fully recovered, onboarding and installation consume support hours that are not billed, early merchants process lower volume while they ramp, and introductory pricing usually applies for the first months. The result is roughly 50% of steady-state margin in the first quarter and about 70% across the first year — which is why any comparison that mixes new and mature merchants is meaningless.
Which margin leak should I fix first?
Sub-scale merchants, almost always. It is the only leak where the fix is a decision rather than a system — you define a minimum viable merchant profile and stop signing below it — and it removes cost rather than reallocating it. Sub-scale accounts commonly make up a fifth to a third of merchant count and contribute negative gross margin, so removing them improves both the median and the support burden at the same time.
How does software attach change the benchmark?
It raises NMGM without raising volume, and it raises it at nearly full margin because the marginal cost of a software seat is close to zero. That is why attach rate is the single largest driver of valuation multiple differences between otherwise similar books. In benchmark terms, a book with 40% software attach can sit a full quartile above an identical book with 10% — same merchants, same volume, same spread.
Are these numbers surveyed or modeled?
Modeled, and the distinction matters. The ranges are derived from publicly reported payment economics — typical spread bands, merchant volume bands by vertical, commonly cited attrition ranges — combined with portfolio arithmetic. They are not the output of a proprietary survey of ISO financials, and no figure here should be quoted as an industry statistic. Use them as a prior to compare your own measured data against, and replace every number with your own as soon as you have it.
The industry measures margin in a way that cannot be compared to anything: a percentage of volume that ignores fixed cost, or a portfolio total that rises whenever you sign anyone. Replace both with one number — net gross margin per merchant per month — and report it as a distribution rather than an average. Healthy sits around $55–95 for small books and $78–84 at scale, with the caveat that the median matters less than the bottom quartile, because that is where the cost, the churn, and the negative margin concentrate. Four leaks keep books out of the top quartile: unrecovered device subsidy, support time nobody bills, concessions that were meant to expire and did not, and sub-scale merchants that cost more to serve than they earn. Three of the four are invisible in your accounts, which is precisely why they last for years. And there is a floor, set by acquisition cost rather than by ambition: above roughly $48–107 of monthly margin, depending on how you acquire, growth creates value; below it, volume only makes the loss bigger. Measure it this afternoon, locate yourself against the band, and fix the bottom tail before you hire another salesperson. OrderPin is a white-label POS platform built for ISO and MSP partners: merchant-level revenue, attributable cost, and software attach in one owned dataset — so the benchmark stops being a guess.
Methodology & Limitations
Basis: ranges are modeled, not surveyed. Inputs are publicly reported payment-industry bands — ISO-side spread over interchange and assessments, merchant monthly volume by vertical, and commonly cited annual attrition ranges — combined with portfolio arithmetic (cost-to-serve, hardware payback, first-year realisation). No proprietary ISO financial dataset was used.
Definitions: NMGM is revenue attributable to a single merchant in a single month, less all costs incurred to serve that merchant that month, before sales and administrative overhead. Agent residual share is treated as a distribution cost and excluded from NMGM. Signing bonuses and one-time hardware sales are excluded.
Assumptions: first-year realisation factor 0.70 of steady-state NMGM, based on a 0.50 first-quarter and roughly 0.92 twelfth-month profile; support loaded at $25 per hour; device payback targeted at 24 months.
Limitations: figures are USD and US-market oriented; vertical medians assume a mixed SMB book and will not hold for enterprise-only portfolios; seasonality (notably lodging and QSR) is not adjusted for; and the bands are wide by design because the underlying dispersion is wide. Treat every number here as a prior to be replaced by your own measurement, not as a citable industry statistic.
About OrderPin
OrderPin is a white-label POS platform built for ISO and MSP partners. We offer full data ownership, flexible pricing, and seamless API integrations to help you build a recurring revenue business under your own brand. Learn more about OrderPin’s white-label solution