
TL;DR — Quick Summary
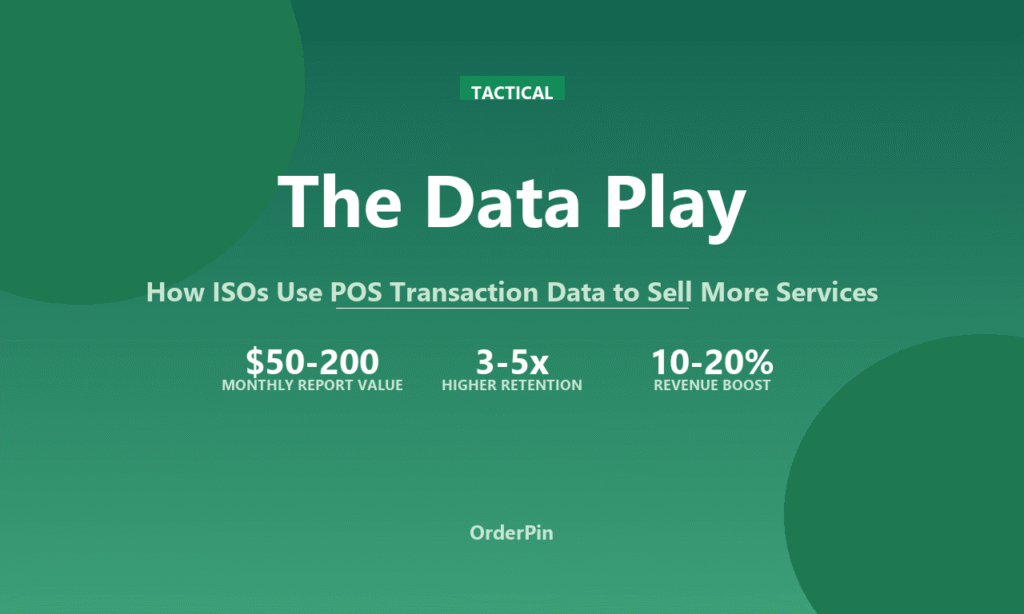
- Every merchant’s POS generates valuable data (peak hours, top SKUs, customer frequency) — ISOs can package this into paid reports ($50-200/month).
- Data monetization creates a new revenue stream beyond payment processing — and makes merchants dependent on your insights (reducing churn).
- The highest-value data products are inventory optimization, labor scheduling, and customer retention analytics — all solve merchant pain points.
Your merchants’ POS systems are sitting on a goldmine of data — and most of them don’t even know it. Every transaction records what sold, when, to whom, at what price. ISOs who learn to extract, analyze, and package this data into actionable reports can create a whole new revenue stream — and make their merchants addicted to their insights (good luck leaving your ISO when you rely on their weekly analytics report to run your business).
1. What Data Is Hiding in Your Merchants’ POS?
Most merchants look at their POS dashboard once a week (if that) — and only to see “how much did we make yesterday?” They’re missing the strategic insights hiding in their own data.
High-value data points ISOs can extract:
- Peak hours/days analysis — when is the restaurant busiest? (affects labor scheduling)
- Top-selling SKUs — which menu items/dishes have highest margin and volume? (inventory optimization)
- Slow-moving inventory — what’s sitting on the shelf/not getting ordered? (waste reduction)
- Customer frequency & recency — who are your regulars, who hasn’t visited in 30+ days? (loyalty targeting)
- Average ticket size trends — is the average order going up or down? (pricing strategy)
- Payment method mix — what % pay by card vs. cash vs. digital wallet? (terminal strategy)
- Server/employee performance — who has highest avg ticket, who upsells most? (staff training)
2. Packaging Data into Paid Services
You don’t need to be a data scientist to monetize POS data. Here are 5 data products ISOs can offer:
Product #1: Weekly Performance Report ($50-100/month)
A simple PDF sent every Monday morning with:
- Revenue vs. last week/last year
- Top 5 items by revenue and by margin
- Slowest 5 items (candidates for menu removal)
- Peak hours heatmap (when to staff up)
- Customer count + avg ticket size
Merchants love this because it’s actionable — they can adjust staffing, change menu, run promotions based on real data, not gut feel.
Product #2: Inventory Optimization Service ($100-200/month)
For retail and restaurant merchants with inventory, this service analyzes:
- Which items are overstocked (tying up cash)
- Which items are understocked (causing stockouts/lost sales)
- Seasonal trends (when to order more of what)
- Waste analysis (what’s expiring before it sells)
This can save a restaurant 5-15% on food costs — easily worth $100-200/month.
Product #3: Labor Scheduling Optimization ($75-150/month)
Labor is the #1 cost for restaurants (30-35% of revenue). Data can show:
- Exactly when peaks happen (down to 15-min intervals)
- Which shifts are overstaffed/understaffed
- Server productivity (sales per labor hour)
- Overtime patterns (where to cut hours)
A scheduling optimization report can save a restaurant $2,000-10,000/month in labor costs — making the $75-150 fee a no-brainer.
Product #4: Customer Retention Analytics ($50-150/month)
For merchants with loyalty programs or customer databases:
- Customer segmentation (VIPs, regulars, at-risk, lapsed)
- Churn prediction (who’s likely to stop visiting)
- Visit frequency trends (are customers coming more or less often?)
- Campaign ROI (which promotions actually bring customers back)
This data helps merchants target promotions to the right customers — increasing repeat visits by 10-30%.
Product #5: Competitive Benchmarking (Custom Pricing)
If you have multiple merchants in the same category (e.g., 10 pizza places), you can create anonymized benchmarks:
- “Your avg ticket is $18 — top performers in your category average $24”
- “Your food cost is 32% — category average is 28%”
- “You’re open for lunch —
This is high-value consulting, not just reporting — ISOs can charge $300-1,000/month for benchmarking services.
3. How to Extract and Process POS Data
Most modern POS systems have APIs or data export features. The basic workflow:
- Get API access or daily data export (most POS systems allow this with merchant permission)
- Pull transaction data weekly (sales by item, by hour, by server, by customer)
- Clean and aggregate the data (remove test transactions, refunds, voids)
- Run analysis scripts (Python/pandas works great for this)
- Generate PDF report (use a template, auto-fill with merchant’s data)
- Email to merchant every Monday morning (consistent = valued)
4. The Revenue Math
Let’s say you offer a $100/month data report to 50 merchants:
- Revenue: 50 merchants × $100/month = $5,000/month = $60,000/year
- Cost: 5-10 hours/week to generate reports (or automate with scripts) = ~$1,000-2,000/month
- Profit: $3,000-4,000/month = $36,000-48,000/year (pure margin on data you already have access to)
And that’s just the direct revenue. The indirect revenue is even bigger:
- Churn reduction: merchants who get weekly insights from you are 3-5x less likely to switch ISOs
- Upsell opportunities: data reveals problems you can solve (e.g., “your peak hours are understaffed” → sell labor scheduling service)
- Referrals: merchants who see value from your reports tell other merchants
5. Getting Started (Step-by-Step)
You don’t need to build a full analytics platform on day one. Start simple:
| Phase | What to Do | Time to Implement | Monthly Revenue (10 merchants) |
|---|---|---|---|
| Phase 1: Manual Reports | Export CSV, analyze in Excel, email PDF | 2-4 weeks | $500-1,000 |
| Phase 2: Semi-Automated | Python scripts pull data, generate report template | 4-8 weeks | $1,000-2,000 |
| Phase 3: Fully Automated | Dashboard + automated alerts + benchmarking | 3-6 months | $3,000-10,000 |
Start with Phase 1 (manual reports for 5-10 merchants). Get feedback. Improve the report. Then automate what you can.
Frequently Asked Questions
Q: Do merchants actually want data reports?
A: The smart ones do. If a merchant says “I don’t need reports, I know my business,” that’s OK — start with the ones who do want insights. Once the others see their competitors using data to optimize, they’ll come around.
Q: How do I get access to merchant POS data?
A: Most POS systems have an API or data export feature. You’ll need the merchant’s permission (they grant API access in their POS settings). Get a data processing agreement signed — it protects both of you.
Q: What if I’m not good with data/analytics?
A: Start with basic reports (revenue, top items, peak hours). You don’t need advanced stats — merchants just want to see their own data presented clearly. As you get comfortable, add more analysis.
Q: Can I white-label the reports?
A: Yes — put your logo on the report, not the POS company’s logo. This is your value-add service, not the POS company’s. OrderPin’s white-label analytics module lets you do this.
Q: How do I price data reports?
A: Start at $50-100/month for basic reports. Increase as you add more value (inventory optimization, labor scheduling, etc.). The key: price based on value delivered, not hours spent. If your report saves a merchant $2,000/month, $100 is cheap.
Why OrderPin for Data Monetization?
- Full API access — pull transaction data, inventory, customers, labor hours programmatically
- White-label analytics dashboard — your brand, your metrics, your merchant portal
- Automated report generation — Python/API integration to auto-generate PDF reports weekly
- Benchmarking engine — anonymized data across your merchant base to create category benchmarks
- Revenue sharing model — OrderPin doesn’t charge extra for data access (it’s included in your ISO subscription)
OrderPin helps ISOs turn POS data into dollars — recurring revenue, happier merchants, lower churn.
POS data monetization is the next frontier for ISOs. Payment processing margins are getting squeezed — data insights are a high-margin, recurring revenue stream that also makes your merchants stickier. The ISOs who figure this out in 2026 will have a massive competitive advantage over those still just “processing payments.”
Data Sources & Further Reading:
- POS Data Monetization Strategies — ISO Insights (2026 Q1)
- Merchant Analytics Adoption Survey — National Restaurant Association (2025)
- Data-Driven Restaurant Management — Cornell Hospitality Report (2025)
- API Access for ISOs — OrderPin Developer Docs (2026)