
TL;DR — Quick Summary
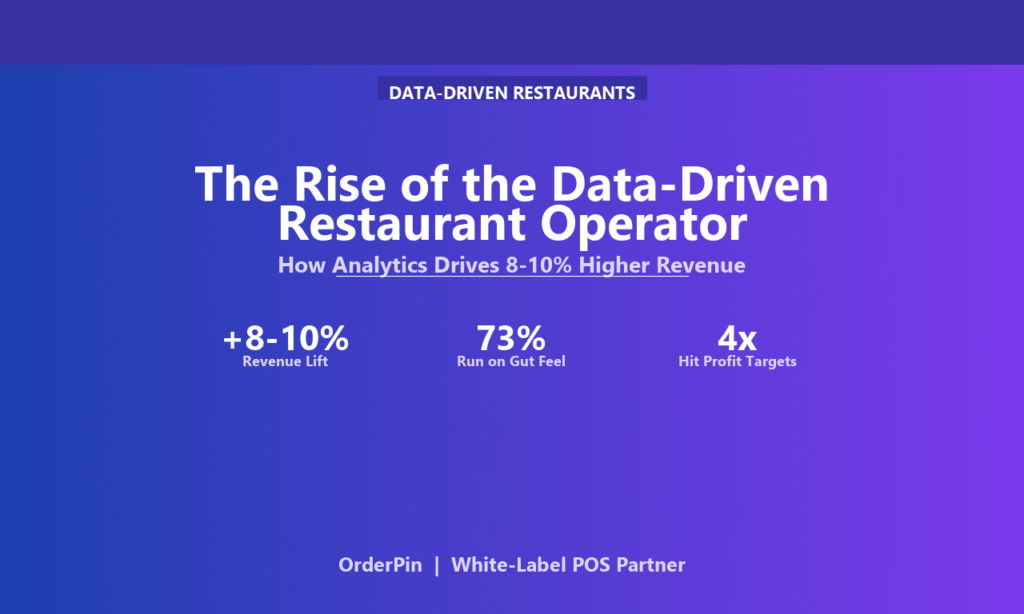
- Data-driven restaurant operators generate 8–10% higher revenue than intuition-led operators — not because they work harder, but because they know what’s actually happening.
- The shift is simpler than it sounds: replacing gut feel with three daily numbers (sales, labor, food cost) and acting on them weekly.
- For ISOs, the data-driven operator is a natural upsell target — they already believe in the value of technology and are looking for the next tool that earns its place.
Walk into any restaurant group that has grown past $1M in revenue and ask the owner how they track performance. A decade ago, the answer was the banker’s statement and a feeling. Today, increasingly, it’s a dashboard — reviewed daily, acted on weekly, and tied to specific decisions.
This is not a story about tech-forward restaurant groups in coastal cities. It’s a story about an operational mindset shift that is reaching every market, every cuisine, and every size — and the ISOs who understand it are winning the deals that are still being competed on price.
What “Data-Driven” Actually Means in a Restaurant
The phrase “data-driven” is overused. In practice, a data-driven restaurant operator doesn’t need a data science degree. They need three things:
| Pillar | What It Looks Like | The Key Metric |
|---|---|---|
| Sales Intelligence | Track sales by item, channel, hour, and day of week every week | Sales per labor hour, item margin % |
| Labor Control | Labor as % of sales tracked daily; schedule vs. actual compared weekly | Labor % by shift, by day part |
| Menu Analytics | Which items sell, which underperform, which have highest food cost | Menu mix %, food cost per item |
| Customer Behavior | First-party ordering data: frequency, recency, average ticket, channel preference | Repeat rate, ticket size, LTV estimate |
The 8–10% Revenue Gap: Where It Comes From
The revenue advantage of data-driven operators doesn’t come from one big move. It comes from compounding dozens of small decisions:
- Menu engineering ($2–4% lift): Data-driven operators cut low-margin items 3–4 weeks faster than intuition-led ones. On a $1M restaurant, that’s $20,000–$40,000 in recovered margin annually.
- Labor optimization ($1–3% lift): Daily labor % awareness prevents the 1–2% average overstaffing that most restaurants carry.
- Demand forecasting ($1–2% lift): Knowing which days and hours are busiest lets owners staff lean without sacrificing service.
- Retention ($1–2% lift): Operators who track repeat rate and LTV market to their existing customers instead of chasing new ones — a fraction of the cost, higher conversion.
None of these are secrets. The data-driven operator simply acts faster, because the data makes the decision obvious.
The Three-Number Daily Review
The most powerful habit a restaurant operator can build takes 90 seconds every morning:
How ISOs Sell to the Data-Driven Operator
The data-driven operator is not a hard sell — they already believe in technology. They’re looking for the tool that earns its place by making the numbers clearer and the decisions easier. The conversation shifts from price to ROI:
| Pitch Angle | What to Say | Why It Lands |
|---|---|---|
| Menu analytics demo | Show their own item-level sales and margin data | Proprietary data from their own restaurant is compelling |
| Labor % tracking | Show labor % by day part vs. their target in a weekly view | Operators who don’t track this have no idea what they’re leaking |
| Side-by-side locations | For multi-location owners: show Store A vs. Store B on one screen | No other system shows this; it’s a revelation for multi-unit operators |
| Retention monitoring | Show repeat rate trends and flag customers who haven’t ordered in 30+ days | Win-back campaigns have 3–5x higher ROI than new acquisition |
Frequently Asked Questions
1. Don’t most restaurant owners already have a POS with reporting?
Yes — but having a POS that generates reports and actually reviewing them are different things. The gap is behavioral, not technical. Data-driven operators build the review habit; most owners haven’t.
2. Is an 8–10% revenue lift realistic for a single restaurant?
Yes. On a $1.2M restaurant, 8% is roughly $96,000 in incremental annual revenue — mostly recovered margin from menu engineering, labor optimization, and waste reduction. The lift is real and measurable.
3. What if the owner is skeptical about data?
Start with one number — labor as % of sales — and one question: “What should it be, and what was it yesterday?” Once the owner sees the gap between target and reality, the data sells itself.
4. How does a data-driven approach help with staffing?
Historical sales by hour and day of week let owners build schedules based on demand data, not guesses. The result: right-sized shifts, lower labor %, and fewer mid-shift scrambles.
5. What’s the single most important metric for a restaurant owner to track?
Labor as % of sales, daily. It’s the biggest controllable cost, moves every shift, compounds quickly when unchecked, and is almost never on an owner’s radar unless they look at it every day.
The ISO’s Edge: Be the Partner Who Closes the Data Gap
OrderPin is a restaurant POS software ISV specializing in omni-channel ordering, all-in-one POS solutions, and full integrations with payment processors, payroll systems, and delivery platforms. For ISOs and MSP partners, a white-label POS built for restaurants gives merchants the data foundation they need to operate smarter — and gives the ISO a sticky, upsell-rich relationship that competes on value, not price.
The restaurant operators who will own the next decade are not the ones who work the most hours. They’re the ones who know their numbers best. Help your merchants build that habit, and the upsells will follow naturally — because once they see the data, they’ll want more of it.