
TL;DR — Quick Summary
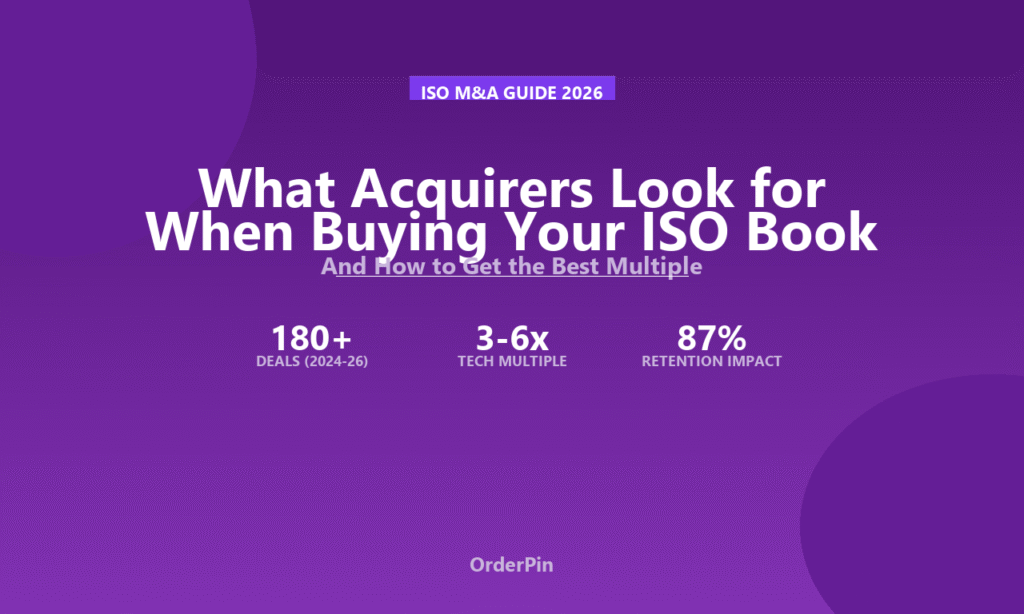
- Acquirers care about more than just processing volume. Retention rate (87%), monthly renewal consistency (82%), and software penetration (76%) are the top three factors that determine your ISO book’s acquisition multiple.
- Pure MID-count portfolios sell for 1–2x ARR. Portfolios with strong retention metrics and software attach rates sell for 3–6x ARR — a gap that reflects how well you’ve locked in your merchants.
- Buyers conduct a 5-category deep dive (retention, revenue quality, technology depth, merchant concentration, compliance) before any deal closes. Most ISOs only prepare for the first two.
The payment industry is mid-consolidation. Global Payments, FIS, Fiserv, and private equity firms have been buying ISO books at record pace — 180+ deals worth $42 billion between 2024 and mid-2026.
But not all portfolios earn the same multiple. Buyers have become sophisticated evaluators. Here is what they actually examine before writing a check.
1. How Acquisition Multiples Have Changed (2018 vs 2026)
| Portfolio Type | 2018 Multiple | 2026 Multiple | Change |
|---|---|---|---|
| Pure MID / residual portfolio | 2–3x ARR | 1–2x ARR | −33% |
| POS reseller + residuals | 2.5–3.5x ARR | 2.5–4x ARR | Flat to slightly up |
| Tech-enabled (POS + SaaS) | 3–4x ARR | 3–5x ARR | +25% |
| Platform (POS + SaaS + data) | N/A | 4–6x ARR | New premium tier |
The gap between a basic payment portfolio and a platform portfolio has widened from 1x to 4–5x in eight years. Buyers are paying more than ever for technology stickiness.
2. The Five-Category Due Diligence Checklist
Category 1: Retention & Attrition (Weight: 30% of valuation)
Buyers demand 3–5 years of merchant-level attrition data. They calculate cohort retention curves, not averages. A portfolio with 90%+ annual retention earns the premium multiple; anything below 75% triggers a discount.
Category 2: Revenue Quality (Weight: 25%)
Recurring SaaS revenue earns 3–5x. Transaction residuals earn 1–2x. One-time hardware sales are valued at 0–0.5x. Buyers analyze revenue mix and seasonality patterns. Portfolios with 30%+ SaaS revenue command the highest multiples.
Category 3: Technology Depth (Weight: 20%)
What percentage of merchants use your POS? How many use additional software modules? Buyers want to see an increasing attach rate trend. They also evaluate API quality, data portability, and whether the tech stack can support growth without rebuilding.
Category 4: Merchant Concentration (Weight: 15%)
If your top 5 merchants represent more than 20% of revenue, that’s a risk. Buyers want diversified portfolios across industries and geographies. A restaurant-heavy portfolio requires higher discount rates.
Category 5: Compliance & Contract Quality (Weight: 10%)
Clean PCI compliance records, well-documented merchant contracts, audited residuals, and no pending regulatory issues. Buyers discount 10–20% for compliance gaps.
3. How the Buyer Pool Is Expanding
4. Pre-Sale Preparation: 12 Actions to Maximize Your Multiple
- Clean and standardize 3+ years of merchant-level data
- Calculate cohort-based retention curves (not simple averages)
- Segment revenue by type: SaaS residuals, transaction residuals, hardware
- Increase software attachment rate on existing merchants
- Reduce top-5 merchant concentration below 20% of revenue
- Audit PCI compliance across all merchants (80%+ pass rate minimum)
- Document merchant contracts with clear terms and auto-renewal clauses
- Prepare a 3-year financial projection with and without new acquisitions
- Build a data room with merchant-level, quarterly trending data
- Show increasing average revenue per merchant (ARPM) trend
- Highlight any proprietary technology or integrations
- Engage an M&A advisor with payment industry experience
5. Real-World Pricing Examples (2025–2026 Deals)
| Portfolio Profile | Merchants | ARR | Multiple | Est. Price |
|---|---|---|---|---|
| Payment residuals only, 15% churn | 800 | $960K | 1.5x | $1.44M |
| POS reseller, 10% churn | 800 | $1.92M | 3x | $5.76M |
| Tech platform (POS + SaaS), 5% churn | 800 | $3.84M | 5x | $19.2M |
Same number of merchants. Different revenue architecture. A 13x difference in exit price.
Bottom Line
The M&A market for ISO books has matured. Buyers have clear, rigorous criteria that go far beyond monthly processing volume. The portfolios commanding premium multiples are those that prove retention, software attachment, and revenue quality over multiple years.
If you’re planning an exit in the next 2–3 years, start preparing now. Clean your data. Add software layers to your merchants. Push retention above 90%. The difference between a 1.5x and a 5x exit is a few years of purposeful portfolio management.
Data sources: The Strawhecker Group (TSG) 2025–2026 ISO M&A Reports, Nilson Report M&A Section Q1 2026, Dealmaker Pulse Payment Industry Survey 2026. All figures reflect U.S. market as of mid-2026.