
TL;DR — Quick Summary
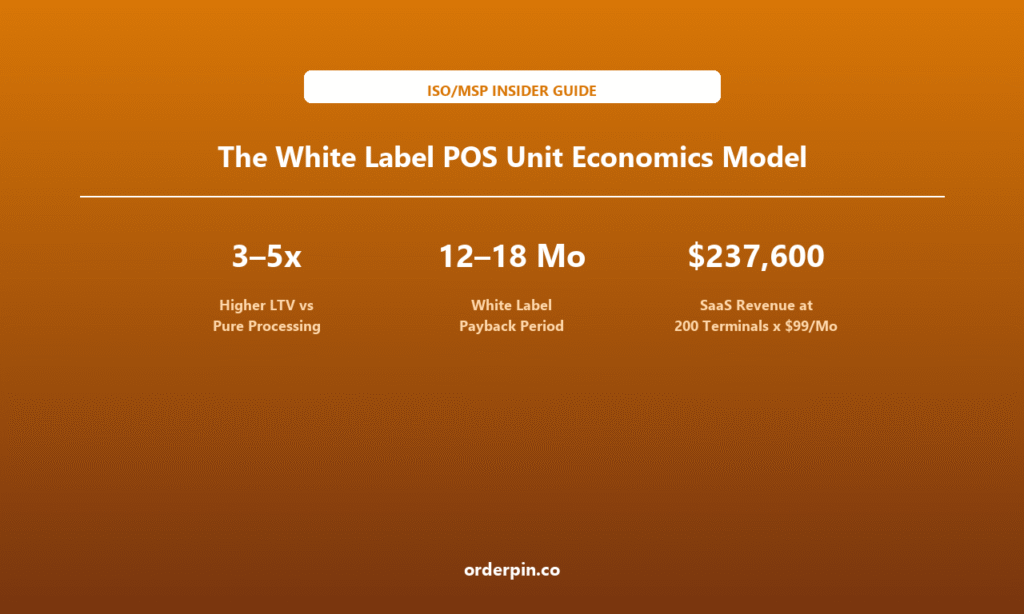
- Most ISOs think in interchange spread; white label demands a different model: SaaS revenue (per-terminal or per-location monthly fees) behaves fundamentally differently from transaction income — it is recurring, predictable, and additive over time. An ISO running 200 white label terminals at $99/month has $237,600 in annualized SaaS revenue that does not exist in a pure-processing model. Modeling white label requires thinking in NPV, not just monthly take-rate.
- Merchant LTV in white label is 3–5x higher than in pure processing — but only if you price and structure the contract correctly: a pure-processing merchant is a take-rate arbitrage: you earn on spread, the merchant can leave when a competitor undercuts you. A white label merchant under a 36-month agreement with a per-location SaaS fee has LTV that compounds because switching costs are asymmetric — the merchant would need to rebuild their brand, retrain staff, and reconfigure integrations to leave you. LTV modeling is where the white label case is won or lost.
- The payback period for white label is 12–18 months; for pure processing it is effectively zero — and that tradeoff is a deliberate strategic choice, not a flaw: white label requires an upfront investment in onboarding, training, and sometimes hardware subsidy that pure processing does not. The payback period is real. But the NPV of a white label portfolio over 5 years — including residual SaaS value at churn — consistently outperforms pure processing for ISOs managing 50+ active merchant locations. The question is not which model is better; it is which model fits your capital, your sales motion, and your patience horizon.
Pure Processing
Payback Period
200 Terminals x $99/Mo
What Every ISO Needs to Know About White Label Unit Economics
There are two ways to model an ISO business. The first is as a transaction-processing engine: interchange spread, monthly volume, take-rate. The second is as a recurring-revenue business: terminals deployed, SaaS per location, LTV, churn rate, and the residual value of the portfolio. The first model tells you what you made last month. The second tells you what your business is actually worth — and which merchant segments are worth acquiring versus winding down.
This article builds the second model for white label POS specifically. It walks through CAC by acquisition channel, merchant LTV by vertical and volume tier, gross margin composition (SaaS vs transaction), payback period, and a 5-year NPV comparison. The numbers are benchmarks calibrated against what OrderPin has observed across its ISO partner base — use them as a sanity check against your own. Your margins may vary by vertical, geography, and pricing model.
Partner, Outbound
Volume Tier
Gross Margin
Pure Processing
1. Customer Acquisition Cost: White Label vs Referral
Referral CAC in white label is typically $0–$500 per merchant: your best acquisition channel is existing merchants referring other merchants. A satisfied restaurant owner who mentions you to a neighboring business costs you nothing in advertising. The challenge is that referral volume is uneven and insufficient to build a growth portfolio on its own — it is the floor, not the ceiling.
Direct/outbound CAC in white label ranges $1,000–$3,000 per merchant location: cold outreach, trade shows, and paid digital ads all carry acquisition costs. The relevant benchmark is your cost per qualified demo — the number of conversations you need to have before a merchant signs. In white label, that cost includes the time to explain the white label model to a merchant who may not understand the concept, which extends the sales cycle and increases CAC compared to pure processing.
Partner/reseller CAC is $300–$800 per merchant location plus revenue share: some ISOs acquire merchants through VARs, business brokers, or industry associations. The upfront CAC is lower than direct, but a 10–15% revenue share on transaction fees over the merchant’s lifetime creates a compounding cost that may exceed direct CAC over a 5-year horizon. Model both the upfront cost and the lifetime revenue-share cost.
2. Merchant LTV by Vertical and Volume Tier
The LTV formula for white label is straightforward: LTV = (Monthly SaaS Revenue + Monthly Transaction Margin) × Average Merchant Lifespan in Months. The critical variable is Average Merchant Lifespan — it is not just churn rate. It is the weighted average duration of merchant contracts, adjusted for early terminations. A merchant on a month-to-month agreement has a lifespan of 1–3 months in your model (they can leave tomorrow); a merchant on a 36-month agreement with 12 months remaining has a lifespan of 12 months.
LTV benchmarks by annual volume tier (OrderPin ISO partner data, illustrative):
| Annual Volume Tier | Monthly SaaS Fee | Est. LTV (36-mo contract) | vs Pure Processing LTV |
|---|---|---|---|
| $50K–$150K/year | $49–$79/mo | $1,764–$2,844 | ~2x higher |
| $150K–$500K/year | $99–$199/mo | $3,564–$7,164 | ~3x higher |
| $500K–$1M/year | $199–$349/mo | $7,164–$12,564 | ~3–4x higher |
| $1M+/year | $349–$599/mo | $12,564–$21,564 | ~4–5x higher |
The LTV premium in white label comes from three sources: (1) SaaS revenue that persists regardless of transaction volume fluctuations; (2) switching costs from 36-month agreements and integrated workflows; and (3) upsell potential — loyalty programs, online ordering, analytics add-ons — that adds $20–$80/month per merchant on top of the base SaaS fee. The pure-processing LTV is dependent entirely on volume and spread; white label LTV has a floor that pure processing does not.
3. Gross Margin: SaaS Revenue vs Transaction Fees
Transaction-only gross margin typically runs 15–25% of take-rate revenue: after interchange costs, network fees, and processing infrastructure, the net margin on transaction income is thin. The ISO’s take-rate spread is the primary margin driver, and it is compressed by competition. An ISO running pure-processing with a 30bps spread on $10M in monthly volume earns $30,000/month gross — but that revenue disappears entirely if volume drops 20% or a competitor undercuts by 5bps.
SaaS gross margin in white label POS typically runs 70–85%: the marginal cost of adding one more merchant to a white label platform is primarily support cost (not zero, but bounded), plus any per-transaction licensing fee charged by the underlying platform provider. If the ISO pays a $15–$25/month per-location platform fee on top of the $99/month SaaS charge to the merchant, gross margin on that location is $74–$84/month — a 74–85% gross margin. Volume does not degrade this margin; a $1M/month portfolio has the same per-location gross margin as a $100K/month portfolio.
The blended margin picture: at a portfolio of 100 white label locations averaging $150/month SaaS revenue, the ISO earns $15,000/month in SaaS revenue. At 75% gross margin, that is $11,250 gross margin per month — before a single transaction is processed. Adding transaction spread on top creates a blended margin that is structurally more resilient than pure processing because the SaaS floor reduces the variance of the revenue stream.
4. Payback Period and the 5-Year NPV Comparison
The payback period for white label is 12–18 months under typical assumptions: assuming a CAC of $1,500 per merchant (midpoint of direct acquisition), monthly SaaS gross margin of $75 per location, and 60% upsell attachment rate adding $30/month in additional gross margin, the blended monthly contribution per merchant is approximately $93/month. Against a $1,500 CAC, the payback period is approximately 16 months. Referral-acquired merchants (CAC $250) payback in under 3 months.
The 5-year NPV comparison (illustrative, $100-merchant portfolio at $150K avg annual volume):
| Metric | White Label (100 Locations) | Pure Processing ($15M/yr vol) |
|---|---|---|
| Year 1 Gross Margin | $135,000 | $67,500 |
| Year 3 Gross Margin | $405,000 | $202,500 |
| Year 5 Gross Margin | $675,000 | $337,500 |
| 5-Year Portfolio Residual Value | $225,000+ (SaaS) | Near zero |
| Total 5-Year Gross Contribution | $900,000+ | $337,500 |
The residual SaaS value is the structural difference: when you sell a pure-processing book, the buyer is acquiring a revenue stream dependent on merchant relationships and competitive pricing. When you sell a white label portfolio with long-term SaaS agreements, the residual value includes the contractual revenue stream plus the platform infrastructure — the ISO that builds the white label portfolio builds an asset that is more valuable and more defensible at exit than the processing-only equivalent.
5. Building Your Own Unit Economics Model
The model has five input blocks: (1) Acquisition — CAC by channel, mix of channels, annual merchant target; (2) Revenue — SaaS fee per location, average transaction volume, take-rate spread, upsell attachment rate; (3) Cost — platform fee per location, support cost per merchant, hardware subsidy if applicable; (4) Retention — average contract term, annual churn rate, per-merchant upsell revenue; (5) Exit — terminal multiple or SaaS revenue multiple at assumed exit year.
Run sensitivity analysis on the three variables that move the most: churn rate (a 5% vs 15% annual churn rate changes 5-year cumulative revenue by 40%), SaaS fee (every $10/month increase in per-location SaaS fee adds $1,200/year per merchant in LTV), and CAC (a $500 reduction in acquisition cost per merchant shifts the payback period by 5–6 months on a typical portfolio). These three variables deserve more attention in your modeling than take-rate or volume assumptions.
The Excel framework you can build in 20 minutes: one sheet for inputs (all five blocks above), one sheet for annual projections (Year 1–5, per merchant and portfolio totals), one sheet for NPV calculation (discount rate, terminal value, residual SaaS value). The OrderPin ISO partner team uses a similar framework to help partners model their own numbers — reach out if you want a starting template to adapt to your specific assumptions.
How OrderPin Supports Your White Label Unit Economics
OrderPin is a white-label POS platform built for ISO and MSP partners. OrderPin’s white label program is designed to give ISOs a SaaS revenue floor (per-location monthly fees) alongside transaction margin — so the portfolio model is achievable, not aspirational. With a flexible pricing structure, per-location fee models, and modular add-ons that increase average revenue per merchant, OrderPin’s ISO partners can build unit economics with 70%+ gross margin and 3–5x LTV advantage over pure processing. Contact the OrderPin ISO team to model your specific numbers.
Frequently Asked Questions
What is the typical payback period for white label POS?
Under typical assumptions — $1,500 CAC (direct acquisition), $150/month SaaS revenue at 75% gross margin, $30/month upsell attachment — the payback period is 12–18 months. Referral-acquired merchants (CAC $250) payback in under 3 months. The payback period is most sensitive to CAC and SaaS fee level; reducing CAC by $500 or increasing the SaaS fee by $10/month each cuts 5–6 months off the payback period.
How much higher is merchant LTV in white label vs pure processing?
Approximately 3–5x higher, depending on volume tier. The LTV premium comes from three sources: (1) SaaS revenue that provides a floor regardless of transaction volume; (2) switching costs from 36-month agreements and integrated workflows; and (3) upsell potential from loyalty, analytics, and online ordering add-ons. A $500K–$1M annual volume merchant on a 36-month white label contract has an estimated LTV of $7,164–$12,564 versus $1,800–$3,000 for pure processing at equivalent volume — roughly a 4x premium.
What is the 5-year NPV advantage of white label over pure processing?
On a 100-merchant portfolio at $150K average annual volume, a conservative estimate shows $675,000 in 5-year gross margin from white label versus $337,500 from pure processing — a 2x gross margin advantage. More importantly, the residual SaaS value of the white label portfolio at Year 5 adds $225,000+ in terminal value that does not exist in a pure-processing model. Total 5-year gross contribution: $900,000+ versus $337,500.
What is the gross margin on white label SaaS revenue?
Typically 70–85%, depending on the platform fee charged by the underlying POS provider. If the ISO charges $99/month SaaS and pays a $20/month platform fee per location, the gross margin is $79/month — a 79.8% gross margin. This margin does not degrade with volume; a $1M/month portfolio has the same per-location gross margin as a $100K/month portfolio. The only marginal cost that scales is support, which is why support efficiency (merchants per support rep) is the key operational metric.
Which acquisition channel has the best CAC for white label?
Referral has the lowest CAC ($0–$500) and the highest conversion rate — merchants who come through an existing customer referral already have social proof and a reason to take the call. The constraint is volume: referrals alone cannot fuel a growth portfolio. The optimal mix is a referral base as the foundation (providing 20–30% of new merchants) combined with a scalable channel (direct outbound or partner) for the remainder. Model the lifetime revenue-share cost of partner/reseller channels separately from upfront CAC to avoid underestimating true acquisition cost.
How does churn rate affect the white label unit economics model?
Churn rate is the single most sensitive variable in the model. A 5% annual churn rate versus 15% changes 5-year cumulative gross margin by approximately 40%. The critical distinction is voluntary versus involuntary churn: involuntary churn (merchant closes their business) is largely unavoidable and should be modeled at 2–4% annually; voluntary churn (merchant switches to a competitor) is the variable that good contract terms and strong merchant relationships address. A 36-month contract with a 90-day notice clause converts voluntary churn into involuntary churn for most of the contract term — making churn rate a contract design problem, not just a service quality problem.
White label POS unit economics are structurally superior to pure processing — 3–5x higher merchant LTV, 70–85% gross margin on SaaS revenue, and residual portfolio value at exit that pure processing cannot match. The tradeoff is a 12–18 month payback period versus near-zero for pure processing, and a sales motion that requires explaining the white label model to merchants rather than competing purely on price. For ISOs managing 50+ merchant locations with a 3–5 year horizon, the NPV of a white label portfolio consistently outperforms pure processing. The model is not complicated to build — five input blocks, a 5-year projection, and a terminal value calculation. The hard part is committing to the investment horizon. OrderPin is a white-label POS platform built for ISO and MSP partners, with pricing structures and partner programs designed to make white label unit economics achievable from the first merchant signed.
About OrderPin
OrderPin is a white-label POS platform built for ISO and MSP partners. We offer full data ownership, flexible pricing, and seamless API integrations to help you build a recurring revenue business under your own brand. Learn more about OrderPin’s white-label solution