
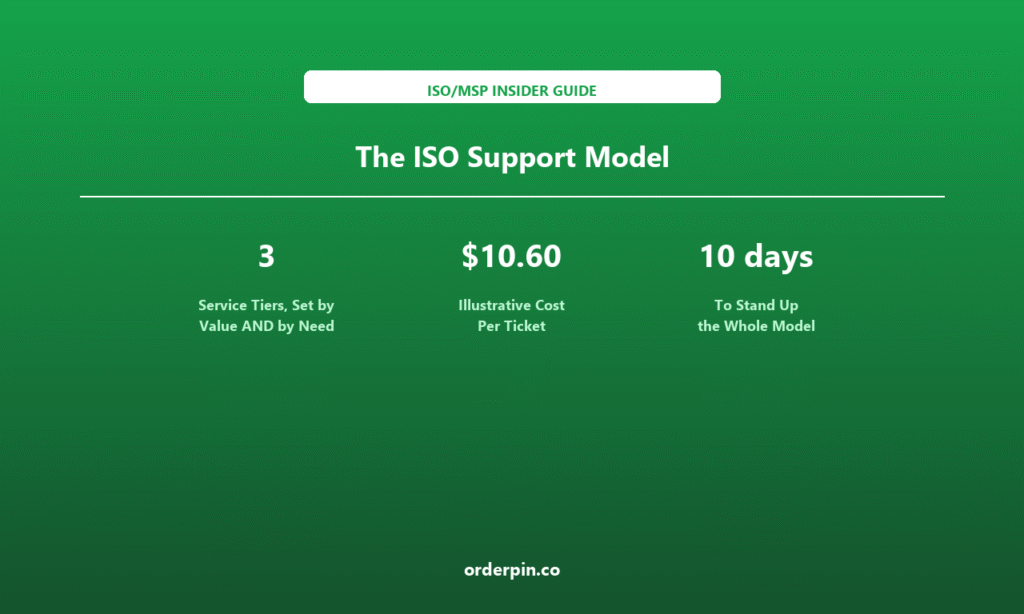
TL;DR — Quick Summary
- Support has no unit price, which is why nobody manages it: it arrives as salaries absorbed into overhead, so the only question ever asked is “do we need another rep?” — a headcount question, not an economics question. One division turns it into a number you can compare against margin.
- Tier on two axes, not one: tiering by merchant value alone puts your highest-need, lowest-margin merchants into your most expensive service tier, which is the single most common way support economics quietly invert. Value sets how much you can afford to spend; need sets how much you will spend regardless.
- Escalation needs a clock and a backup, not a person: most escalation policies are really “ask the owner,” which works until the owner is the bottleneck. Four design rules fix it, and one of them is about merchants in the wrong tier rather than tickets handled badly.
What This Playbook Delivers
You will end up with three service tiers assigned by two axes, four written escalation rules with named backups, one cost-per-ticket number with its assumptions beside it, and a weekly metric set. Budget ten days of part-time work — mostly counting things you already have.
The Cost Nobody Prices
Every ISO knows what a merchant is worth, roughly. Fewer know what a merchant costs to keep. Processing has a price, hardware has a price, residuals have a price — support arrives as salaries folded into overhead, and the only question it ever triggers is whether to hire another person. That is a headcount question, and headcount questions get answered with opinions.
The fix is a single division. Support has no unit price, so give it one: total fully loaded cost over tickets resolved. Nothing about your operation changes when you compute it, but the conversation changes completely, because suddenly support can be compared against the thing it is supposed to be protecting — the per-merchant margin established in the ISO margin benchmark.
This playbook is about running support, not choosing who provides it. If you are still deciding between in-house, vendor-delivered and hybrid delivery, that is a different decision with different inputs. What follows assumes the delivery model is settled and asks a narrower question: how do you tier it, how do you escalate it, and what does it actually cost per ticket.
1. Why Support Cost Stays Invisible
Three structural reasons, and all three are fixable with counting rather than investment:
It is not allocated to the merchant. Support sits in overhead, so no merchant record shows what that merchant consumed. A merchant contributing $40 a month in net margin and consuming $45 a month in support looks profitable on every report you run.
Volume is never counted. Ask how many tickets you handled last quarter and you will get an estimate from whoever touches the helpdesk most. Without a denominator there is no unit cost, and without a unit cost there is nothing to trend.
The work is not categorised. “Support ticket” covers a password reset, a failed batch, and a merchant who never learned how to run a close-out. Those three have completely different costs and completely different fixes, but only the third one is worth spending money on. Until the categories exist, every ticket looks like a cost instead of some tickets looking like a defect.
2. Tier on Two Axes, Not One
The standard approach is to tier by merchant value and stop there: biggest merchants get the named person, smallest get the queue. It is intuitive, and it systematically produces the wrong answer, because value determines what you can afford to spend while need determines what you will spend whether you can afford it or not.
A small merchant that calls twice a month is not a small-support merchant. Tier them by value alone and they land in a tier priced for occasional contact, then consume multiples of that budget every month, and because the overrun is invisible you never notice. The two-axis model exists to surface exactly that merchant.
The Two Axes
| Axis | High | Mid | Low | Where it comes from |
|---|---|---|---|---|
| Value | Above $80/mo NMGM | $40 – $80 | Below $40 | Your own NMGM distribution — the tier bands should be re-cut from your book |
| Need | Above 0.8 contacts/mo | 0.3 – 0.8 | Below 0.3 | Counted contact rate over a trailing 90 days, not a guess by the rep |
Bands above are illustrative starting points derived from typical SMB portfolio shape, not measured benchmarks. After one quarter, re-cut both axes at your own quartiles so each band holds roughly a quarter of your merchants.
The Four Quadrants, and What Each Gets
This merchant is worth the money and genuinely needs the attention. Give a named person, a quarterly review, and direct access. The goal is not fewer tickets — it is tickets that arrive earlier, before they become a churn event.
Do not spend on them — they do not need it. But when they do contact you, it must be fast, because a valuable merchant’s rare contact is usually serious. Self-serve by default with priority routing, and a human within the hour.
This is where support economics go to die. Something has to change and there are only three options: reprice so the service is paid for, restrict to self-serve plus education, or exit at renewal. Leaving them as they are is a choice, and it is the expensive one.
Knowledge base, chat, and community. No human route unless a payment is actually failing. Most merchants belong here and most are perfectly happy — the risk is only in letting them drift upward without anyone noticing.
3. Escalation: Four Rules That Keep It off the Owner’s Desk
Most ISOs have an escalation policy that is really one instruction: if it is serious, get the owner. It works for a while, and then the owner becomes the constraint on everything, response times degrade across the board, and the policy quietly reverts to “try to handle it yourself.” Four rules prevent that.
Every tier needs a named backup, not just a named owner
The failure mode is almost never incompetence — it is absence. Someone is on vacation, in a renewal meeting, or out sick, and the escalation target is unreachable for six hours. Write a backup for every tier and rotate it monthly so the backup stays current. A single named owner is a single point of failure wearing the costume of accountability.
Escalate on a clock, not on judgment
“Escalate if it seems serious” guarantees that escalation depends on who is working that day. Replace it with: no documented next action within N hours means auto-escalate, regardless of severity. The clock does the escalation, which removes both the hesitation and the argument about whether it was warranted.
Escalate to a role, never to a person
“Escalate to Maria” is how one person becomes the de facto head of everything. Escalate to Tier 2, to Technical, to the on-call engineer — and let a rota decide who that is this week. Roles survive staffing changes; names do not.
The worst escalation is a merchant in the wrong tier
Some tickets escalate forever, get handled well every time, and still never resolve — because the merchant is being given a service level that does not match their situation. These are not ticket failures, they are tiering failures, and no amount of better escalation fixes them. Any merchant escalating more than twice in a quarter triggers a tier review, not a third escalation.
Three Tiers with Clocks Written In
| Tier | First response | Resolution target | Escalation clock | Backup |
|---|---|---|---|---|
| Tier 1 — Queue & self-serve | Under 1 business hour | Same business day | 4 business hours with no next action → Tier 2 | Rotating weekly |
| Tier 2 — Named CSM | Under 4 business hours | 1 business day | 1 business day without documented next action → Tier 3 | Named peer, rotated monthly |
| Tier 3 — Technical | Under 1 hour, acknowledged | Workaround or fix path within 1 business day | 2 business days without a communicated path → engineering / vendor, named owner | On-call rota, not a name |
These are recommended starting targets, not measured industry norms. Set yours slightly ahead of what you currently achieve, then tighten. Note that Tier 3 commits to a path, not to a fix — promising a fix commits you to someone else’s timeline.
4. Cost per Ticket: The Calculation
One division, but the numerator is where everyone goes wrong. Salary alone understates the cost by roughly a third, and any number built on salary alone will produce confident decisions from wrong inputs.
The Formula
Cost per ticket = fully loaded support cost ÷ tickets resolved in the period
Fully loaded means salaries plus benefits (typically 25–35% on top), plus helpdesk and tooling seats, plus phone and communication cost, plus the share of management time that goes into support. If one manager spends a quarter of their time on support, a quarter of their cost belongs in the numerator.
Tickets resolved means closed tickets, excluding spam and duplicates — and if your helpdesk counts every reply as activity, reconcile to distinct merchant issues before dividing, or the number will flatter you by a factor of two or three.
Worked Example — 5,000 Merchants, Three Reps
| Input | Value | Note |
|---|---|---|
| 3 support reps, fully loaded | $186,000 | $62,000 each, benefits included |
| Helpdesk, phone, tooling | $11,000 | Annualised |
| Management allocation | $25,000 | 25% of one manager’s cost |
| Total annual support cost | $222,000 | The numerator |
| Contact rate | 0.35 / merchant / month | Replace with your measured rate |
| Tickets per year | 21,000 | 5,000 × 0.35 × 12 — the denominator |
$222,000 ÷ 21,000 = $10.57 per ticket. At an average handle time of about 25 minutes, that implies roughly $25 per hour fully loaded — the same figure used for support time in the margin benchmark, so the two models tie out rather than contradicting each other.
Then Do the Division That Actually Matters
Cost per ticket is a unit price, useful for benchmarking your own efficiency. The decision-relevant number is support cost per merchant per month, because that is what can be compared against margin:
0.35 contacts × $10.57 = $3.70 per merchant per month — about 5.4% of a $68 NMGM. That is the cost of keeping an average merchant, and it is the number that should sit beside margin on every merchant-level report you build.
Run the same arithmetic per tier and it stops being an average. If 12% of your merchants — 600 of them — generate 40% of all tickets, they consume 8,400 tickets × $10.57 = $88,800 a year, or $148 per merchant per year. On a merchant producing $30 a month of net margin, that is 41% of their margin spent on support — more than any other cost line they carry.
That last calculation is the reason this exercise is worth the ten days. It is not that those merchants are bad; it is that nobody has ever been able to see them. The point of a unit price is that it turns an argument about headcount into an arithmetic statement about which merchants pay for themselves.
5. The Five Numbers to Report Weekly
Five, not fifteen. Each one exists because it catches a different way support quietly stops working.
| Metric | Why it is on the list | What it catches |
|---|---|---|
| Cost per ticket, by tier | The unit price. Falls when deflection works, rises when complexity grows. | Whether efficiency is improving or you are just serving easier tickets |
| Support cost per merchant per month | The only version comparable against NMGM. | Merchants whose service costs more than their margin |
| First response, P50 and P90 | Report percentiles, never the average — same reason as everywhere else in this series. | The tail that generates the angry call |
| Reopen rate | The honest proxy for whether a ticket was resolved or merely closed. | Speed achieved by closing things that come straight back |
| Contact rate per merchant per month | The demand side. The only metric that improves when the product or the education improves. | Whether you are getting more efficient or the merchant base is getting needier |
6. The Ten-Day Build Plan
Six steps. The order matters — step three cannot be done honestly before step two produces a number.
Count the tickets
Export everything for the last 90 days. One row per issue: merchant, date opened, category, date closed, reopened yes/no. If the categories do not exist yet, create five — access, hardware, transaction issue, how-to, other — and backfill by sampling rather than trying to classify all of it perfectly.
Build the numerator honestly
Take the fully loaded cost from finance, not from memory. Benefits, tooling, management allocation. Then divide, and write the assumptions beside the result — because a number without its inputs will be re-litigated every quarter by someone who remembers a smaller one.
Assign every merchant two bands
Value band from your own NMGM distribution, need band from the trailing 90 days of contact rate. Do not let reps assign need from memory — it will correlate with how much they like the merchant. Write the resulting service level for each of the four quadrants.
Write escalation as clocks with backups
One page: three tiers, response clock, resolution target, escalation clock, named backup role. Apply the four rules from section 3 — especially the rule about escalating to a role rather than a person, which is the one people quietly skip.
Publish the five numbers weekly
Same five, same page, every Monday, per tier. Weekly rather than monthly because monthly reporting tells you the quarter went badly, which is not actionable. The contact-rate line is the one to watch most closely — it is the only one that improves when you fix a root cause.
Decide what to do with the expensive quadrant
Low value, high need. Now that you can see them and price them, choose: reprice so the service is paid for, restrict to self-serve plus a targeted education push, or decline renewal. All three are legitimate; continuing unchanged is the only option that is not, because you have now measured what it costs.
The Cost-Per-Ticket Calculator
Copy this into a spreadsheet. Fill the grey inputs; the rest is arithmetic.
| Line | Input | Result |
|---|---|---|
| Headcount × fully loaded cost | 3 × 62,000 | 186,000 |
| Tooling, phone, helpdesk (annual) | 11,000 | 11,000 |
| Management allocation | 25% × 100,000 | 25,000 |
| Total annual support cost | sum | 222,000 |
| Active merchants | 5,000 | 5,000 |
| Contact rate (per merchant per month) | 0.35 | 0.35 |
| Tickets per year | merchants × rate × 12 | 21,000 |
| Cost per ticket | total ÷ tickets | $10.57 |
| Support cost per merchant per month | rate × cost per ticket | $3.70 |
Then run it per tier. The blended number is the least useful output this calculator produces. The version that changes decisions is the same three lines run separately for each service tier, then divided by that tier’s average NMGM.
7. Three Ways This Breaks
The default mistake, and it produces a support organisation that spends the most on the merchants with the worst economics. Revenue tells you what you can afford; contact rate tells you what you will actually spend. You need both on the merchant record before any tier assignment is defensible.
It starts as “for serious issues” and becomes the actual policy within two quarters, because it is always correct and never scalable. Once the owner is in the path, response time is bounded by their calendar, and the team learns to wait rather than decide.
AHT is easy to measure and easy to game: close faster by resolving less. It falls right before reopen rate rises, so anyone reporting AHT alone will be pleased for about six weeks and then confused. Pair it with reopen rate or drop it entirely.
Where OrderPin Changes the Demand Side
Most support cost reduction comes from reducing contacts, not from making each contact cheaper — and most contacts are merchants asking how to do something they were never shown. That is the same root cause the onboarding SLA addresses earlier in the merchant’s life, which is why these two playbooks should be run together.
- Usage is visible per merchant: you can see who has not run a close-out or opened a report, so education becomes targeted rather than a quarterly email blast.
- Single system, fewer handoffs: when software and payments sit on one platform, the “is this a software problem or a processing problem” ticket largely disappears — and that category is usually a meaningful share of volume.
- Merchant-level history on one record: support can see onboarding, usage and transaction history together, which turns the most expensive ticket type — the one that requires reconstructing context — into a short one.
- Attach and support read from the same data: the same one-merchant view feeds attach rate and support cost per merchant, so service level and margin can be evaluated together instead of in separate meetings.
Frequently Asked Questions
What is a reasonable cost per ticket?
There is no useful cross-industry number, because it depends entirely on your loaded labour cost and your contact rate. The worked example here lands at $10.57 for a three-rep team serving 5,000 merchants, which implies roughly $25 per hour fully loaded. Calculate your own rather than comparing — and once you have it, trend it quarterly rather than judging it in absolute terms.
How many support tiers should we have?
Three. Two cannot separate “valuable and quiet” from “valuable and demanding,” which is the distinction that matters most. Four or more creates routing overhead and tier-boundary arguments that cost more than the service differentiation returns. If you find yourself wanting a fourth tier, the real problem is usually that the quadrant assignment is stale.
Should low-value, high-need merchants be dropped?
Not as a first move. Reprice first, because some of them will pay for the service they use. Then restrict to self-serve with a targeted education push. Exiting is the last option and should be reserved for merchants who decline to change price or behaviour — and even then, do it at renewal rather than mid-term, and read the churn benchmark first so you know what a departure actually costs.
How do we keep escalation off the owner?
Name a backup role for every tier, escalate on a clock rather than on judgment, and make the escalation target a role rather than a person. Then measure it: if a meaningful share of escalations still lands on the owner, the policy has not actually been adopted no matter what the document says. The owner should be an escalation of last resort with a documented trigger, not the default route for anything uncomfortable.
What if we are too small for tiering?
Under roughly 300 merchants, skip the tiers and do the arithmetic instead: one cost-per-ticket number and one support-cost-per-merchant number per month. Tiering matters once the spread in contact rate is wide enough that a blended service level is visibly unfair to someone. The calculator works at any size; the quadrant model does not.
Where do these figures come from?
They are illustrative arithmetic built from stated inputs — headcount, loaded cost, tooling, management allocation, contact rate — not survey data. The $10.57 per ticket is what those specific inputs produce, and if your inputs differ, so will the result. Nothing here should be quoted as an industry average; replace every input with your own and keep the structure.
Support is the largest unmeasured cost in most ISOs for one reason: it has no unit price, so it is never compared against the margin it is supposed to protect. Fix that with one division — fully loaded cost over tickets resolved — and then do the version that matters, support cost per merchant per month, which can be set beside NMGM. Tier on two axes rather than one, because value determines what you can afford and need determines what you will spend regardless, and tiering on value alone reliably funds your worst economics. Write escalation as clocks with named backup roles so it stops ending at the owner, and remember that a merchant who escalates repeatedly is usually in the wrong tier rather than being badly served. Report five numbers weekly, not fifteen monthly, and use the calculator to find the quadrant that quietly consumes forty percent of your tickets for twelve percent of your merchants. OrderPin is a white-label POS platform built for ISO and MSP partners: merchant-level usage, transaction history and payments sit on one record, which is what turns support from a cost centre you staff into a cost you can actually manage.
Assumptions & How to Adapt
Nature of the content: this is an operating framework with illustrative arithmetic, not a data report. Every figure — $10.57 per ticket, $3.70 per merchant per month, the 41% margin consumption — is the output of inputs stated in the article. No survey or proprietary dataset was used, and none of these should be quoted as industry averages.
Consistency with the rest of this series: the $68 NMGM and the $25 per hour support valuation are carried from the ISO margin benchmark, which is itself modeled rather than surveyed. If you have measured your own margin, substitute it and the percentages here will move accordingly.
How to adapt: re-cut both tiering axes at your own quartiles after one quarter of data, set response targets slightly ahead of current performance rather than at an aspirational number, and recalculate cost per ticket whenever headcount or merchant mix changes materially — it is a quarterly number, not an annual one.
About OrderPin
OrderPin is a white-label POS platform built for ISO and MSP partners. We offer full data ownership, flexible pricing, and seamless API integrations to help you build a recurring revenue business under your own brand. Learn more about OrderPin’s white-label solution