
TL;DR — Quick Summary
- Attach rate is the valuation hinge, not volume: Two books of 5,000 merchants processing the same dollar amount can exit at 3x and 6x. The difference is what share of those merchants pay for software every month — the multiple tracks recurring gross profit, and processing residuals are not recurring revenue to a buyer.
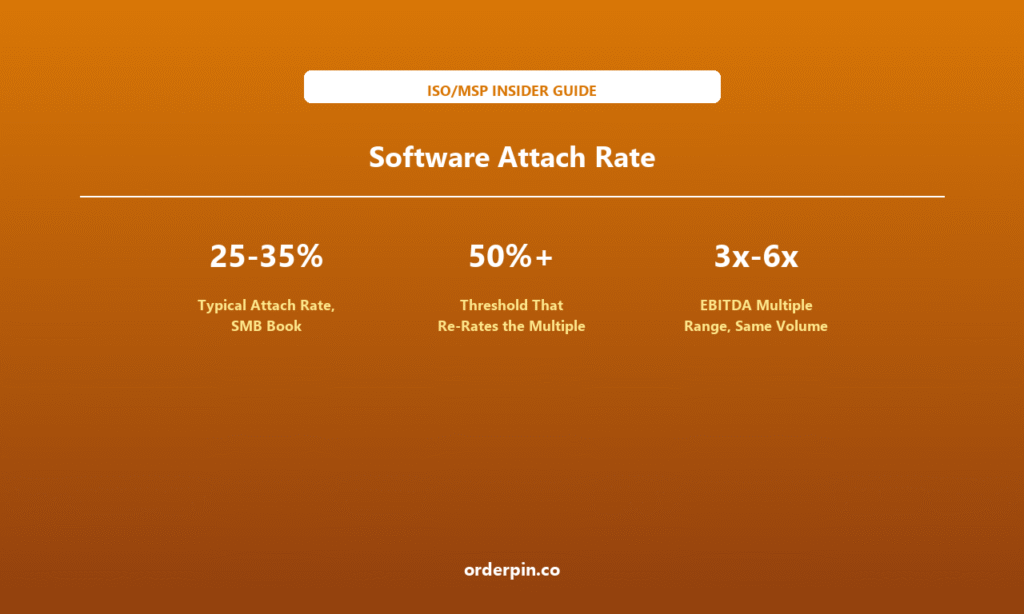
- Typical is 25–35%, and the re-rating starts around 50%: An average SMB book attaches a third of its merchants. Top quartile runs 55–65%. Between roughly 45% and 60% a book stops being priced as a residual stream and starts being priced as a software business — that is the cliff worth climbing.
- Fifteen points is a 90-day project, not a three-year one: On a 5,000-merchant book, moving attach from 30% to 45% is worth about $5.1M of enterprise value — and roughly $160,000 a year in avoided churn. Most of the gain comes from changing the default quote, not from building new software.
SMB Book
Re-Rates
Same Volume
Same Volume, Half the Price
Two ISOs walk into the same buyer’s office. Both process around $400 million a year. Both have roughly 5,000 active merchants. Both are profitable. One is offered 3x EBITDA and the other 6x, and neither owner can explain the gap without pointing at things the buyer does not actually price: relationships, tenure, “our service is better.”
The gap is almost always one number. Software attach rate — the share of active merchants paying for software every month — determines what fraction of gross profit is recurring, contractual, and independent of processing volume. A buyer paying 3x is buying a residual stream that happens to arrive monthly. A buyer paying 6x is buying a subscription business with a payments attach. Those are different asset classes, and the only thing separating them is how many merchants you put software in front of and charged for.
This article gives the benchmark you need to locate yourself, the thresholds where a multiple re-rates, the arithmetic behind the 3x-to-6x claim, and a 90-day plan that moves attach without building anything new. As with the rest of this series, the ranges below are modeled from public payment and software economics plus portfolio arithmetic — the methodology note at the end states the assumptions and the limits.
Not Just Licensed
Processing Merchants
Not Bundled Free
Vs Residual Spread
1. Define Attach Rate So It Cannot Be Gamed
Attach rate is one of the easiest metrics to inflate accidentally. Every ISO we have seen quoting a number above 60% has, on inspection, been counting something other than merchants who pay for software every month. Four definitions have to be fixed before the number means anything:
Paying, not entitled: A merchant that receives software free because it was bundled into a rate concession is not attached. It raises the count and destroys the metric, because the buyer will strip free software out of recurring gross profit in the first hour of diligence. Count merchants with a software line item on the statement.
Active, not dormant: A merchant paying $29 a month but not processing is a churn event in progress, not an attachment. Both sides of the ratio must be live: software-paying merchants over active processing merchants at period start.
Exclude promotional periods: Ninety-day free trials, “first three months included” bundles, and hardware-included software seats all inflate the ratio for a quarter and then revert. Report attach on a same-store basis with trials excluded, or expect the number to fall the month after you present it to a buyer.
Report the second number too: Attach rate tells you how many merchants pay. Recurring gross profit share — software gross profit divided by total gross profit — tells you how much of the P&L is actually recurring. Both are needed, because a book with 60% attach on a $19 software tier has a very different multiple from one with 45% attach on a $99 tier.
Attach Rate by Portfolio Size
Share of active merchants paying for software monthly. Bar = P25 to P75. Marker = median.
Median (P50)
Active merchant count →
The gradient is nearly three to one from sub-scale to national, and it is not explained by better software. It is explained by process. Below 1,000 merchants, software is sold opportunistically by whoever remembers to mention it. Above 20,000, it is in the standard quote, in the onboarding checklist, and in the rep’s commission plan. The median ISO does not have an attach problem, it has a default problem — software is an optional line item when it should be the starting configuration.
2. The Benchmark Table
Three views on the same metric. Portfolio size sets the operating discipline, vertical sets what merchants will actually buy, and price tier sets how much the attach is worth. Reading only the blended number hides all three.
View 1 — By Vertical (median attach rate)
The pattern follows one question: does the merchant’s day require a screen? Salons, restaurants and retail counters live on a terminal, so scheduling, tips, inventory and loyalty are things they will pay for. Fuel and convenience operators run a back-office integration once and rarely touch a dashboard. Attaching into a low-screen vertical is not a sales problem you can train your way out of — it is a product-fit problem.
View 2 — Attach Rate and the Multiple It Buys
| Attach rate | Recurring share of GP | EBITDA multiple | Who is bidding |
|---|---|---|---|
| Under 20% | Under 25% | 2.5 – 3.5x | Residual buyers and processors |
| 20 – 35% | 25 – 40% | 3.5 – 4.5x | ISO roll-ups buying distribution |
| 35 – 50% | 40 – 55% | 4.5 – 5.5x | PE platforms underwriting recurring revenue |
| 50 – 65% | 55 – 70% | 5.5 – 6.5x | Vertical SaaS buyers with payments attach |
| 65% + | Over 70% | 6.5 – 7.5x | Software strategics and software-multiple buyers |
The step between the 35–50% band and the 50–65% band is the one that matters most, because that is where the buyer set changes rather than just the price. Below it you are being valued on a residual stream with some software attached. Above it, you are being valued as a software company that also processes payments — and the second auction has more bidders and a different reference multiple.
3. Why a Multiple Responds to Attach at All
Buyers pay for what they can underwrite. Four properties of software revenue are easier to underwrite than residual income, and attach rate is the proxy for all four:
A software subscription has terms, a renewal date, and a cancellation process. A residual has a rate sheet and a merchant who can move volume to another provider tomorrow without notifying anyone. Buyers pay for the difference between a customer and a convenience.
Software is switching cost made concrete: stored configurations, staff habits, integrations, reconciliation history. An attached merchant churns at roughly half the rate of a processing-only merchant, which lowers the discount rate a buyer applies to every future year.
Software gross margin runs 80–90% and the incremental cost of one more seat is close to zero. Processing gross margin is a spread that compresses every time a merchant negotiates, and interchange is not yours to control. Same revenue line, very different durability.
Residual books are bought by a small pool of strategic acquirers who price on volume and risk. Software businesses are bought by PE platforms and strategics pricing on ARR. Crossing the attach threshold does not raise your price inside the old auction — it puts you in a new one.
4. The Arithmetic Behind 3x and 6x
Here is the whole argument on one book. It is deliberately conservative: software is priced at a modest tier, only part of the incremental gross profit is assumed to reach EBITDA, and the multiple moves by one band rather than two.
Worked Example
5,000 merchants · $65 software ARPU · 30% → 45% attach
Fifteen points of attach is 750 merchants paying $65 a month. That is $585,000 of annual software revenue at an 85% gross margin, or $497,000 of gross profit. Assume only 60% of it reaches EBITDA — the rest absorbed by support and success headcount — and you add $298,000 of EBITDA.
On a $2.4M EBITDA base, that is $2.4M × 3.5x = $8.4M before, and $2.7M × 5.0x = $13.5M after. The fifteen points are worth about $5.1M of enterprise value — roughly three times the incremental revenue they produce, because the multiple moved at the same time as the earnings.
What Each Attach Band Is Worth on a 5,000-Merchant Book
| Attach | Paying merchants | Software GP / yr | Multiple | Enterprise value |
|---|---|---|---|---|
| 20% | 1,000 | $663,000 | 3.5x | $7.7M |
| 30% | 1,500 | $994,500 | 3.5x | $8.4M |
| 45% | 2,250 | $1,491,750 | 5.0x | $13.5M |
| 60% | 3,000 | $1,989,000 | 6.0x | $18.0M |
| 75% | 3,750 | $2,486,250 | 6.5x | $21.4M |
Software GP = merchants × attach × $65 × 12 × 85%. EBITDA assumes 60% of incremental software gross profit flows through, on a $2.4M base at 30% attach; the multiple column follows the bands in View 2. The table is deliberately flat between 20% and 30% — the multiple does not move below roughly 35%, so early attach gains pay off only through earnings, which is exactly why most ISOs stop trying too soon.
5. What Attach Does Before You Ever Sell
The exit multiple is the least immediate reason to care. Attach changes the operating numbers first, and the operating numbers are what the multiple is ultimately derived from. Two of those numbers already have benchmarks in this series: per-merchant gross margin in the ISO margin benchmark, and attrition by tenure and vertical in the merchant churn benchmarks. Attach is the lever that moves both.
Four Effects That Show Up Before the Exit
| Effect | Mechanism | Order of magnitude |
|---|---|---|
| Churn falls | Attached merchants churn at roughly half the rate of processing-only merchants, so each point of attach lowers the blended rate | 15 points of attach ≈ 2 points lower churn ≈ $160,000/yr avoided loss |
| ARPU rises | Software sits on top of the processing margin instead of competing with it, so merchant value grows without repricing the processing | +$65/mo per attached merchant at 85% margin |
| Sales cost per merchant falls | Selling software into an existing base costs a fraction of acquiring a new merchant, so the same headcount produces more gross profit | Base campaign CAC is typically 10–20% of new-merchant CAC |
| Forecast accuracy improves | Recurring revenue makes next quarter’s gross profit predictable, which lowers working capital stress and the risk premium a buyer applies | The main driver of the discount-rate difference between 3x and 6x |
6. The 90-Day Plan to Move Fifteen Points
Attach rate is not a product roadmap item. It is a pricing decision, a commission plan, and a campaign against a list you already own. The three phases below are sequenced so that each one produces a number the next one can use.
Days 1–30 — Measure the true number and build the list. Export every active merchant with three fields: is there a software charge on the last statement, has the merchant logged in or transacted through the software in the last 30 days, and which vertical. That gives real attach, dormant attach, and the gap by vertical. Most ISOs discover that 10–20% of their “attached” merchants are paying for software they have not opened in six months — which is both a churn warning and an activation campaign already paid for.
Days 31–60 — Change the default, not the pitch. Put software in the standard quote and make processing-only the exception that requires approval. Reprice so the bundle is cheaper than the two components bought separately, which removes the only rational reason a merchant declines. Then change compensation: pay on activated software seats at day 60, not on software sold. A rep who is paid on sold software will always sell software that never gets used.
Days 61–90 — Activate the base you already billed. Take every merchant with an entitlement and no usage, assign them by name to an account manager, and run a 30-day activation sequence built around one milestone each: first menu imported, first schedule published, first report exported. Measure weekly against a target of 40% of the dormant list. This phase is usually worth more than the new-logo motion, because the revenue is already contracted and only the habit is missing.
Three Guardrails While You Do This
- Never buy attach with free software. Giving it away raises the count, lowers recurring gross profit, and is stripped out by any competent buyer. If a merchant will not pay $29, they will not renew at $29 either.
- Report attach by cohort, not just in total. A flat blended number can hide a falling new-cohort rate covered by an aging installed base — the same dilution trap that makes churn look like it is improving.
- Keep the second metric beside the first. Track recurring gross profit share alongside attach. If attach rises while recurring GP share falls, you are selling cheaper seats to more merchants, and the multiple will not follow.
How OrderPin Makes Attach Sellable
Attach rate stalls for a product reason as often as a sales reason: the software is a separate login, a separate bill, and a separate vendor, so the merchant experiences it as overhead rather than as part of the till. OrderPin is a white-label POS platform built for ISO and MSP partners, and it puts the software inside the system the merchant already uses.
- Software on the same screen as the terminal: ordering, inventory, scheduling and reporting run in the POS the merchant already touches daily, which is what converts an upsell into a default.
- Your brand, your price, your billing: the subscription is yours to set and invoice, so attach revenue lands on your P&L as recurring gross profit instead of as a third-party referral.
- Usage is visible: login and transaction activity per merchant make “paying but dormant” measurable, which is the difference between a real attach rate and an inflated one.
- Full data ownership: attach, usage, vertical and tenure live on one merchant record, so the cohort and vertical splits — and the diligence pack — come from an export rather than a project.
Frequently Asked Questions
What is a good software attach rate for an ISO?
Around 25–35% is typical for an SMB book, 38–52% is where disciplined operators sit, and 55–65% is top quartile. The number to aim for depends on your vertical mix more than your sales team: a salon-heavy book can carry 60% while a fuel-heavy book will struggle past 20%. Compare against the band for your mix, not against the industry average.
Why does 50% attach change the valuation multiple?
Because above roughly half, recurring gross profit becomes the majority of the P&L, and the buyer set changes from residual acquirers to software and PE platforms that price on recurring revenue. The step is not a smooth slope — it is a reclassification. That is why the difference between 45% and 55% is worth more than the difference between 25% and 35%.
Should free software count toward attach rate?
No. Attach rate should count merchants with a software charge on their statement. Free or bundled software inflates the ratio, contributes nothing to recurring gross profit, and will be removed during diligence — usually with an adjustment to the purchase price rather than a conversation. Track it separately as “entitled but unpaid” if you want visibility into conversion opportunity.
How long does it take to move attach rate meaningfully?
Fifteen points in a quarter is realistic if most of the gain comes from an existing base that already has entitlements. Gains that require new software capability take two to three quarters. The fastest lever is almost always the default quote — it changes new-merchant attach from the next sales cycle without any product work.
What is the difference between attach rate and recurring revenue share?
Attach rate counts merchants; recurring revenue share measures dollars. A book with 60% attach on a $19 tier has a lower recurring share than a book with 40% attach on a $99 tier. Both matter, because the multiple tracks the dollar share while attach rate is the operational lever you can actually move. Report them side by side or the metric can improve while the valuation does not.
Are these attach and multiple figures surveyed or modeled?
Modeled. The bands are derived from publicly reported payments and vertical-software economics, disclosed transaction multiples, and portfolio arithmetic — not from a proprietary survey of ISO books. No figure here should be quoted as an industry statistic. Use them to locate your own measured attach rate, and replace them with your actual distribution as soon as you have it.
Two books with identical volume exit three times apart, and the difference is almost entirely one ratio: the share of active merchants paying for software every month. Typical is 25–35%; the multiple re-rates somewhere around 50%, because above that line recurring gross profit is the majority of the P&L and the buyer set changes from residual acquirers to software buyers. On a 5,000-merchant book, moving attach from 30% to 45% adds about $497,000 of annual software gross profit — and about $5.1M of enterprise value, because the multiple moves with the earnings. The work is not a product roadmap: measure the true rate, put software in the default quote, pay reps on activated seats, and run a 30-day campaign against the merchants you already bill. Do not buy the number with free software, and do not report attach without recurring gross profit share beside it. OrderPin is a white-label POS platform built for ISO and MSP partners: software on the screen the merchant already uses, under your brand, on your invoice, with usage data you own — which is what makes attach rate a number you can move rather than a number you report.
Methodology & Limitations
Basis: modeled, not surveyed. Inputs are publicly reported payments and vertical-software economics, disclosed transaction multiples for payment and POS businesses, and portfolio arithmetic (attach → recurring gross profit → EBITDA → multiple). No proprietary ISO dataset was used, and no figure here is a citable industry statistic.
Definition: attach rate = active merchants with a software charge on the current statement ÷ active processing merchants at period start. Promotional periods excluded; entitled-but-unbilled merchants excluded; dormant merchants (no usage in 30 days) reported separately rather than counted or discarded.
Assumptions: software ARPU $65/month at 85% gross margin; 60% of incremental software gross profit assumed to reach EBITDA after support and success cost; EBITDA base of $2.4M for the enterprise-value table; multiple bands follow the observed step function in View 2 rather than a continuous curve.
Limitations: multiples vary widely by size, growth and buyer appetite at the time of sale, so the bands describe direction rather than a quote; vertical medians assume a mixed SMB book and will not hold for a single-vertical book at scale; the churn benefit of attach is drawn from the AE2 benchmark and is likewise modeled; and none of this substitutes for a valuation performed on your own audited numbers.
About OrderPin
OrderPin is a white-label POS platform built for ISO and MSP partners. We offer full data ownership, flexible pricing, and seamless API integrations to help you build a recurring revenue business under your own brand. Learn more about OrderPin’s white-label solution