
TL;DR — Quick Summary
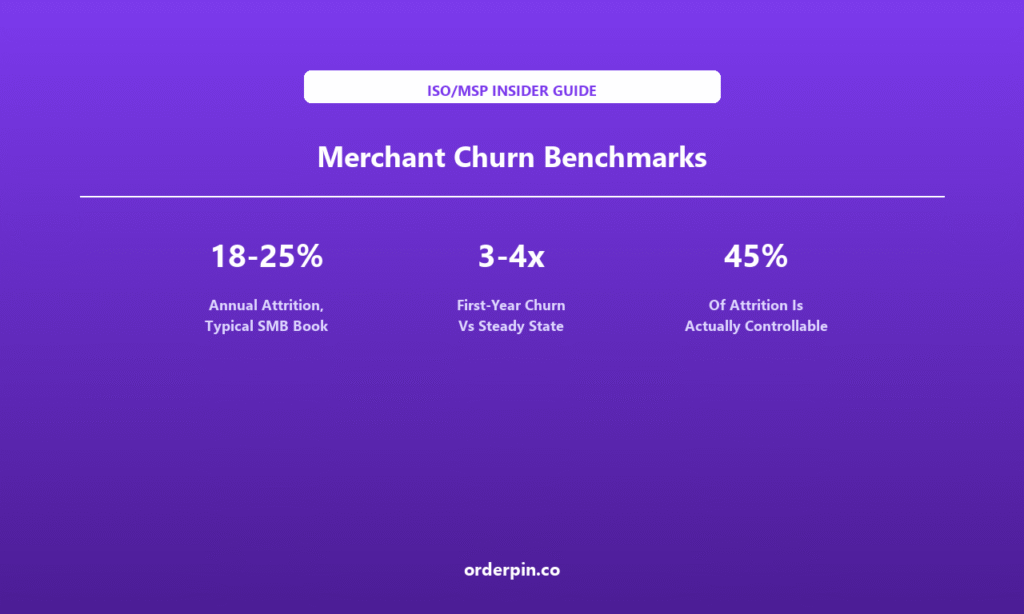
- Normal is 18–25% a year, and normal is not good: A typical SMB book loses about a fifth of its merchants annually. That is the benchmark, not the goal — the top quartile runs 10–14%, and the gap is not sales skill, it is who they let in and what happens in the first ninety days.
- First-year churn runs 3–4x steady state: 40–58% annualized in the first quarter of a merchant’s life, falling to 6–10% after year two. Any single churn number that mixes new and mature merchants is measuring your growth rate, not your retention.
- About 45% of attrition is controllable: Roughly a third is business failure you cannot prevent, but wrong-fit merchants and failed onboarding together account for nearly half of all departures — and those two are decided by your own policies, before the merchant ever processes a card.
Typical SMB Book
Vs Steady State
By Policy
Churn Is Managed Against a Feeling
Ask an ISO owner what their churn rate is and you will usually get one of three answers: a number they heard from an industry report, a number computed once two years ago, or a confident “it’s low.” None of them is a benchmark, because a churn rate without a definition, a denominator, and an age profile is not a measurement — it is an impression with a decimal point attached.
This article fixes the three things that make churn comparable. It defines the metric precisely enough that two ISOs can argue about it productively. It gives baseline attrition by vertical and by merchant tenure, so a number can be located rather than admired. And it supplies the cohort view that answers the only question worth asking when churn is high: is this a sales problem or an onboarding problem? Those two failures look identical in a headline churn rate and could not be more different in what you should do about them.
One note on the numbers, same as anywhere in this series: the ranges below are modeled from publicly reported payment and SMB economics plus portfolio arithmetic, not from a proprietary survey. The methodology note at the end states the assumptions and the limits. Treat every figure as a prior to test your own measurement against.
Not Dollars Lost
One Formula
Never Pooled
Not Just Score
1. Define Churn So Two People Can Disagree Productively
The metric is annualized logo churn: merchants that stopped processing or terminated the agreement during the period, divided by merchants active at the start of the period, expressed as an annual rate. Logo churn counts merchants. Revenue churn counts dollars. They are not interchangeable, and the gap between them is itself diagnostic.
Three things must be fixed before the number means anything: the trigger (last transaction date, or contract termination — pick one and never switch), the window (90 days is the practical minimum for a stable rate, 12 months is what gets quoted), and the denominator (merchants active at period start, never the closing count).
Growth dilutes the rate and hides the problem: if you add merchants faster than you lose them, the closing-count denominator makes churn look like it is falling while the same absolute number of merchants walks out every month. This is the retention version of the portfolio-average illusion: the ratio improves, the economics do not.
Attrition by Merchant Tenure
Annualized logo churn by age band. Bar = P25 to P75. Marker = median.
Median (P50)
Merchant age band →
The shape of that table is the whole argument. A merchant is at roughly eight times the risk of leaving in its first quarter than after its fourth year. Whatever you believe about retention is happening in a window measured in weeks, not years — which is why every retention programme that begins with a quarterly business review at month nine is arriving after the decision has already been made.
2. The Benchmark Table
Three views on the same metric. Portfolio size sets the ceiling, vertical sets what is normal for your mix, tenure tells you where in a merchant’s life you are actually measuring. Reading only one of the three is how a good book gets managed into a bad one.
View 1 — By Vertical (median annualized logo churn)
The spread between professional services and e-commerce is more than three to one. That is not service quality — it is the underlying failure rate of the merchant’s own business and the ease of switching. Judging a book’s retention without adjusting for mix is the most common analytical mistake in this industry.
View 2 — By Portfolio Size (median annualized logo churn)
| Portfolio | P25 | Median | P75 | What usually explains the gap |
|---|---|---|---|---|
| Under 1,000 | 18% | 23% | 30% | Thinnest support, least onboarding structure |
| 1,000 – 5,000 | 17% | 21% | 26% | Process exists but is not enforced |
| 5,000 – 20,000 | 14% | 18% | 23% | Onboarding is systematised; support is tiered |
| 20,000 + | 11% | 15% | 19% | Admission standards + software lock-in |
The improvement from sub-scale to national is about one third, and most of it comes from two things a small ISO can copy this quarter: a written minimum merchant profile, and a first-90-days process that someone owns by name.
3. Why the First Year Runs 3–4x Steady State
The first-year penalty is not mysterious and it is not mostly about price. Four things stack inside a twelve-month window, and each one is fixable:
The merchant bought a promise — faster checkout, better reporting, fewer chargebacks — and in month two it has a terminal, a statement, and a learning curve. The gap between the promise and the experience is widest exactly when switching cost is lowest.
A merchant in month one has almost nothing invested: no integrations, no stored payment methods, no staff habits, no reconciliation history. Every month of use adds switching cost, which is why churn falls on its own even when service does not improve.
A merchant sold on a rate it cannot sustain, or signed into a product its business does not need, exits as soon as the first statement makes the mismatch visible. This is not a retention failure — it is a sales-qualification failure arriving late.
Delayed activation, an installation that had to be rescheduled twice, a pricing setup error on the first invoice — these all land inside the first sixty days. A merchant that starts badly rarely recovers its confidence, which is the mechanism described in AC70.
4. The Cohort View: Sales Problem or Onboarding Problem?
Two ISOs can both run 24% annual churn and need completely opposite responses. The headline rate cannot tell them apart; the distribution of departures across age bands can. This is the single most useful diagnostic in retention work, and it costs one export.
Diagnosing Churn From Where It Concentrates
| Departures concentrate in | Most likely cause | What to check | The fix that actually works |
|---|---|---|---|
| 0 – 3 months | Sales qualification | Retained vs lost: vertical, volume, ticket size | Written minimum merchant profile; commission clawback on 90-day attrition |
| 4 – 12 months | Onboarding and early support | Days to first transaction; first-90-day ticket count | Owned activation SLA; a named person for the first 90 days |
| 13 – 24 months | Value not renewed | Software usage, statement disputes, contact frequency | Regular business reviews with a stated next outcome |
| 24+ months | Competition or price | Exit interviews; competitor quotes at renewal | Renewal management and a defensible reason to stay |
5. What a Point of Attrition Actually Costs
Churn feels expensive and is usually underpriced, because the cost shows up in two places that are budgeted separately: acquisition spend to replace the merchant, and gross margin that never arrives. Put both on the same line and the arithmetic becomes hard to argue with. The gross margin figure below is the per-merchant NMGM defined in the ISO margin benchmark — if you have not measured your own, start there first.
Worked Example
5,000 merchants · $68 NMGM · $600 CAC
Every point of annual churn is 50 merchants. At a $68 monthly gross margin that is $40,800 of gross margin walking out per year, plus $30,000 of re-acquisition spend to stand still — about $71,000 per point. Moving from 22% to 16% is therefore worth roughly $425,000 a year, which is usually more than the entire marketing budget that produced the book in the first place.
Annual Cost at Different Attrition Levels
| Annual churn | Merchants lost | Replacement CAC | Gross margin lost | Vs. the 22% baseline |
|---|---|---|---|---|
| 22% | 1,100 | $660,000 | $897,600 | baseline |
| 18% | 900 | $540,000 | $734,400 | +$283,200 |
| 16% | 800 | $480,000 | $652,800 | +$424,800 |
| 12% | 600 | $360,000 | $489,600 | +$708,000 |
Gross margin lost = merchants lost × $68 × 12. Replacement CAC = merchants lost × $600. The improvement column adds saved CAC to saved first-year margin, which is the conservative version — it does not count subsequent years of a retained merchant.
6. Measure, Locate, Act
The same three steps as any benchmark: get the number, place it against the band, then act on the specific thing the placement reveals.
Measure (one export, one hour): Take 24 months of merchant records with activation date and last transaction date. Compute annualized logo churn overall, then split by the three views above — tenure band, vertical, and portfolio size. If the overall number and the tenure-split numbers disagree, trust the split.
Locate (ten minutes): Compare against the band for your size and mix. Within two points of the median is normal, and normal is not the goal. More important than the level is the shape: if 60% of your departures happen under twelve months, your headline rate is a symptom and the cause is upstream.
Act (one quarter, one change): If departures cluster in 0–3 months, write a minimum merchant profile and put a clawback on early attrition — do not launch a loyalty programme. If they cluster at 4–12 months, own the activation process and measure days to first transaction. Only if losses are concentrated past 24 months is this a competitive or pricing problem, and only then is discounting a rational response.
How OrderPin Makes Churn Measurable
Cohort analysis fails for a mundane reason: activation dates live in one system, last transaction dates in another, and the vertical classification in a third. OrderPin is a white-label POS platform built for ISO and MSP partners, and it holds those three fields on one merchant record.
- Tenure is a property of the merchant record: activation date, tenure band, and current status sit together, so the tenure split is an export rather than a data-engineering project.
- Real last-transaction dates: because transaction data is yours, “stopped processing” is measurable at the merchant level instead of inferred from a residual report that lags by a month.
- Mix is visible: vertical and volume bands are part of the record, which is what lets you compare your churn against the right benchmark instead of the industry average.
- Full data ownership: the cohort table is yours to build and keep, including the first-90-days analysis that tells you whether the problem is sales or onboarding.
Frequently Asked Questions
What is a normal merchant churn rate for an ISO?
Around 18–25% annualized logo churn for a typical SMB book, falling to 15–19% at scale and rising toward 26–30% in high-failure verticals such as e-commerce and quick-service restaurants. Top-quartile operators run 10–14% overall. The more useful question is not what the average is, but whether your churn is concentrated in a specific tenure band — because that determines whether it is fixable this quarter or structural.
Why is first-year churn so much higher than steady state?
Because four things overlap in the same twelve months: the promised value has not been realised, switching cost is still near zero, bad-fit merchants discover the mismatch, and onboarding failures all land inside the first sixty days. Each factor decays on its own, which is why churn falls even when service does not improve — and why the first ninety days are where retention is actually decided.
Should I measure logo churn or revenue churn?
Both, and the gap between them is diagnostic. Logo churn counts merchants and tells you whether the book is stable; revenue churn counts dollars and tells you what happened to the P&L. If revenue churn is much higher than logo churn, you are losing your larger merchants — an adverse-selection problem that a merchant-count target will never surface. If revenue churn is lower, your small merchants are leaving and the headline understates the operational cost.
How do I run a cohort analysis with the data I have?
You need three fields per merchant: activation date, last transaction date, and a status flag. Group merchants by activation month, then calculate what share of each cohort was still active at 3, 6, 12, and 24 months. Plotting those curves against each other immediately shows whether newer cohorts are improving — and if a cohort that looked fine at month three collapses by month twelve, the cause is onboarding rather than sales.
How much does one point of attrition cost?
On a 5,000-merchant book at $68 monthly gross margin and $600 acquisition cost, about $71,000 a year: $40,800 of gross margin that never arrives plus $30,000 of replacement spend. That is why retention projects routinely pay back faster than acquisition projects — the merchants are already bought, installed, and trained.
Are these churn figures surveyed or modeled?
Modeled. The ranges are derived from publicly reported SMB survival and payment-industry retention patterns combined with portfolio arithmetic, not from a proprietary survey of ISO books. No figure here should be quoted as an industry statistic. Use them as a prior against which to locate your own measured data, and replace them as soon as you have twelve months of your own history.
Normal attrition is 18–25% a year, and normal is a description rather than a target. What matters more than the level is the shape: first-year churn runs three to four times steady state, so a merchant is at its greatest risk in the weeks when you have invested the most to win it and delivered the least. Split the number by tenure, by vertical, and by portfolio size before drawing any conclusion — and then look at where departures concentrate, because that single cut separates a sales problem from an onboarding problem, which look identical in the headline rate and require opposite remedies. Roughly 45% of attrition is controllable: wrong-fit merchants and failed onboarding, both decided by your own policies before a card is ever processed. The economics justify the work — about $71,000 per point on a 5,000-merchant book — and retention projects pay back faster than acquisition because the merchants are already bought and installed. Measure the number properly, locate it against the band, act on the age band where your losses actually sit, and fix the door before adding more people to push merchants through it. OrderPin is a white-label POS platform built for ISO and MSP partners: activation dates, transaction history, and merchant mix on one owned record, so cohort analysis is an export rather than a project.
Methodology & Limitations
Basis: modeled, not surveyed. Inputs are publicly reported SMB survival rates by sector, payment-industry retention patterns, and portfolio arithmetic (tenure decay, replacement cost, gross margin). No proprietary ISO dataset was used, and no figure here is a citable industry statistic.
Definition: annualized logo churn = merchants lost in the period ÷ merchants active at period start, annualized. Loss trigger is 90 consecutive days without a transaction or formal termination. Closing-count denominators are explicitly excluded because they understate churn in growing books.
Assumptions: tenure bands are measured from activation; vertical medians assume a mixed SMB book; cost model uses $68 NMGM and $600 CAC, consistent with the AE1 margin benchmark; stored-value and seasonal businesses are not deseasonalized.
Limitations: ranges are wide because underlying dispersion is wide; attribution between “business failure” and “competitive loss” is inherently fuzzy at the moment of exit; and modeled bands cannot substitute for your own twelve-month cohort history. Replace every number here with measured data as soon as it exists.
About OrderPin
OrderPin is a white-label POS platform built for ISO and MSP partners. We offer full data ownership, flexible pricing, and seamless API integrations to help you build a recurring revenue business under your own brand. Learn more about OrderPin’s white-label solution