
TL;DR — Quick Summary
- The true cost of churn is 3-5x what most ISOs calculate: When you count acquisition cost sunk, competitive exposure, relationship equity lost, and recovery effort, a single lost merchant typically costs 3-5x the monthly revenue you thought you were losing.
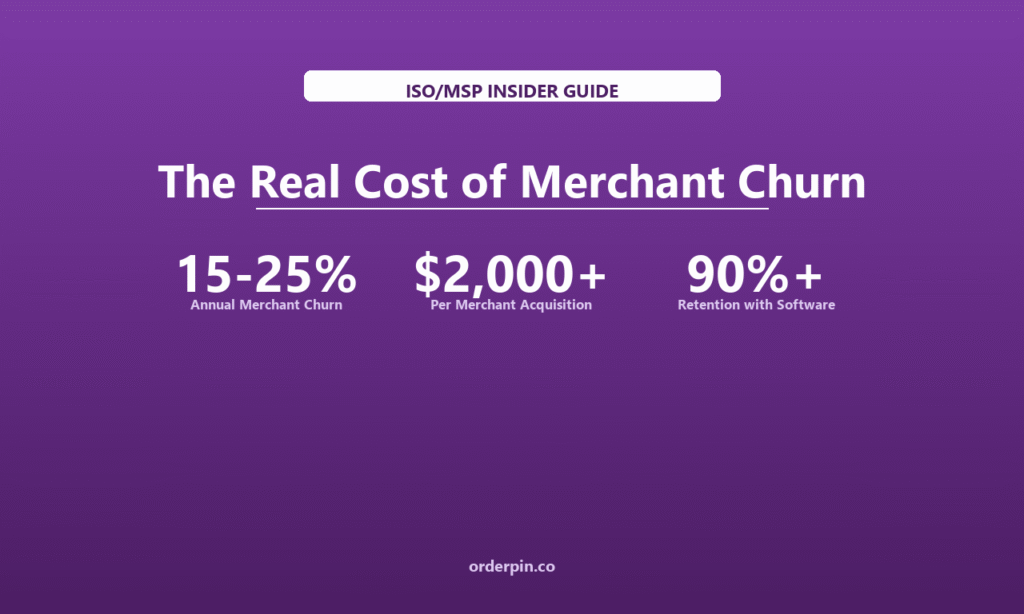
- 15-25% annual churn is industry normal — and industry ruin: Most ISO portfolios churn at 15-25% per year without systematic retention programs. Over a 5-year period, that means replacing your entire merchant base 2-3 times just to stay flat.
- Retention ROI is quantifiable and usually positive: A focused customer success program — typically costing 5-10% of revenue — can reduce churn from 20% to 8-10%, generating a net ROI of 200-400% on the retention investment.
Churn Rate
Acquisition Cost
Software Stickiness
What Is Merchant Churn — and Why Are Most ISOs Undercounting It?
Most ISOs think about churn as the processing revenue they lose when a merchant closes or switches providers. That’s the visible number — and it’s real. But it’s also the smallest piece of the actual cost. The true cost of merchant churn includes every cost you’ve already paid to acquire that merchant, every competitor you expose your book to, every relationship equity you’ve spent building that account, and every effort it takes to win a replacement.
When you count all of these, a single lost merchant typically costs 3-5x what most ISOs think they’re losing. A merchant doing $500/month in processing revenue might actually cost $60,000-$80,000 when you factor in acquisition cost, the merchant they take to a competitor, the residual stream you’ve already earned but invested in the relationship, and the cost of finding and onboarding a replacement.
This matters because most ISOs make retention investment decisions based on the visible number — the monthly processing revenue at risk — not the true cost. They invest too little in retention, lose too many merchants, and then wonder why their residual income isn’t growing even as they sign new accounts.
Churn Without Program
vs. Visible Revenue
Retention Investment
Customer Success
1. The Full Churn Cost Formula
To make good retention investment decisions, you need to calculate the true cost of losing a merchant. The formula isn’t complicated — but most ISOs have never written it down. Here’s the framework:
Visible revenue loss: Monthly processing revenue × months remaining (or annual if you annualize). This is what most ISOs stop at — and it’s the smallest component.
Acquisition cost sunk: Every dollar you spent to acquire the departing merchant — sales commissions, marketing, travel, proposals, onboarding — is a sunk cost that produces zero return when the merchant leaves. If you paid $2,000 to acquire a merchant and they leave in year one, you’ve lost the acquisition cost plus the revenue gap.
Competitive exposure: When a merchant leaves for a competitor, you’re not just losing revenue — you’re giving a competitor access to your merchant base. That merchant may refer others. They may share pricing intelligence. They may validate your competitor’s pitch to other merchants you share.
Recovery cost: Finding, winning, and onboarding a replacement merchant costs time and money — typically $1,500-$3,000+ per merchant in direct costs, plus the revenue gap during the search period.
Relationship equity depreciation: If you’ve spent time building a strong merchant relationship — helping them with problems, providing guidance, being responsive — that investment depreciates when they leave. You’re essentially writing off the residual value of that relationship work.
When you add these up, the true annual cost of merchant churn for most ISOs is typically 3-5x what they calculate using visible revenue alone. This changes the ROI calculus on retention investment significantly.
2. Why 15-25% Annual Churn Is More Damaging Than It Sounds
Most ISOs accept 15-25% annual churn as normal. It’s industry average, after all. But that framing misses the compounding damage that churn does to a business that should be compounding its residual income over time.
Consider what 20% annual churn actually means: if you sign 100 new merchants in year one, and you keep 80 of them, you’re down to 80 by year two. To get back to 100, you need to sign 25 new merchants just to replace the 20 you lost — plus whatever new ones you need to grow. Over five years at 20% churn, you’ll need to replace your entire merchant base roughly 2.5 times just to stay flat. Every new merchant you sign is partially being used to replace churned merchants, not to grow income.
Now add the true cost calculation: at 20% churn with an average merchant ACV of $6,000/year and $2,000 acquisition cost, an ISO with 200 merchants is losing approximately $240,000/year in visible revenue — but $720,000-$960,000 in true economic cost when you factor in sunk acquisition costs, competitive exposure, and recovery expenses. That’s a number that changes how you think about every customer success investment.
Churn Cost Breakdown: Visible vs. True
| Cost Component | Per Merchant | % of True Cost | Visible Only? |
|---|---|---|---|
| Visible Revenue Lost | $6,000/yr | 20-25% | YES |
| Acquisition Cost Sunk | $2,000 | 30-35% | NO |
| Competitive Exposure | $1,500 est. | 20-25% | NO |
| Recovery & Replacement Cost | $1,500-3,000 | 20-25% | NO |
| Total True Churn Cost | $11,000-12,500 | 100% | NO |
3. Building a Retention ROI Framework
Once you understand true churn cost, you can build a retention investment framework that generates positive ROI. The math is straightforward: if reducing churn by even 5 percentage points saves you more than the cost of the retention program, the investment is justified.
Step 1: Calculate your baseline churn cost
Count your merchants lost in the past 12 months. For each, calculate: (1) monthly processing revenue × 12, (2) acquisition cost paid, (3) estimated competitive exposure ($1,000-$2,000 per merchant), (4) recovery cost to replace. Add these to get your total annual churn cost.
Step 2: Model retention program cost and expected impact
A basic customer success program — regular check-in calls, proactive problem resolution, quarterly business reviews, annual contract reviews — typically costs 5-10% of portfolio revenue. At that investment level, ISOs typically see churn rates drop from 15-25% to 8-12%. Model the cost and the expected churn reduction.
Step 3: Calculate net ROI
Net savings from reduced churn minus program cost, divided by program cost = ROI. Most well-designed retention programs generate 200-400% ROI. If your calculation shows positive ROI, the investment is justified — and usually underinvested.
How OrderPin Helps ISOs Reduce Merchant Churn
OrderPin is a restaurant POS software ISV whose white-label platform creates the kind of merchant stickiness that drives retention from 80% to 95%+. Software that runs the merchant’s daily operations creates switching costs, deepens the relationship, and makes your ISO indispensable — not just a processing provider.
- Deep operational integration: When your POS runs the restaurant’s orders, tables, inventory, and reporting, replacing you means rebuilding daily operations. That friction is retention insurance.
- Merchant success data: The platform gives you real-time visibility into merchant performance — sales trends, peak hours, menu performance — giving your ISO actionable data to bring to QBRs and relationship reviews.
- White-label relationship ownership: The merchant’s daily experience is with your brand, not OrderPin’s. Every feature, every report, every support interaction reinforces the merchant’s relationship with your ISO.
- Reduced churn, higher ACV: ISOs on the OrderPin platform consistently report lower churn rates and higher merchant lifetime value compared to processing-only books.
4. High-ROI Retention Tactics
Not all retention investments generate equal returns. Based on what separates ISOs with 8-10% churn from those with 20-25%, here’s what actually works:
Quarterly business reviews (QBRs): The single highest-ROI retention activity. Schedule 30-minute quarterly calls with your top merchants to review their performance data, identify opportunities, and proactively address concerns. Merchants who feel looked after don’t switch. Cost: your time. ROI: typically 500%+.
Proactive outreach on warning signs: High chargeback rates, declining transaction volume, negative reviews, or missed contract anniversaries are all signals that a merchant is at risk. Build a system to flag these signals and reach out before a competitor does.
Annual relationship reviews before renewal: At the 11-month mark of annual contracts, schedule a dedicated conversation about what’s working, what’s not, and what you’re going to improve next year. This prevents the passive drift that turns “I’ll think about it” into a lost merchant.
Software platform ownership: The highest-leverage retention tool is having your technology running the merchant’s daily operations. Software-first ISO relationships generate 90%+ annual retention rates because switching costs are real and deep.
5. The Retention-First ISO
The ISOs who consistently grow their residual income over time share one characteristic: they treat retention as a revenue-generating activity, not a cost center. Every dollar invested in keeping a merchant reduces the acquisition burden required to maintain income growth, compounds over the merchant’s lifetime, and builds the relationship depth that generates referrals, testimonials, and case studies.
The practical shift is simple: stop thinking about churn as “the revenue merchants take when they leave” and start thinking about it as “the cost of not investing enough to keep them.” The math almost always supports a more aggressive retention posture. ISOs who run the numbers consistently discover they’re underinvesting in retention by 50-75%.
Industry retention research consistently shows that ISOs with systematic customer success programs achieve 8-12% annual churn compared to 15-25% for ISOs without them — a difference that compounds dramatically over a 5-year period.
Frequently Asked Questions
What is the true cost of merchant churn for an ISO?
The true cost is typically 3-5x the visible processing revenue lost. It includes: (1) acquisition cost already sunk ($1,500-$3,000 per merchant), (2) competitive exposure when the merchant goes to a competitor, (3) recovery cost to find and onboard a replacement, and (4) relationship equity depreciation. For a merchant doing $6,000/year in processing, the true churn cost is often $11,000-$15,000.
What is a normal merchant churn rate for ISOs?
Industry average is 15-25% annually for processing-only ISO relationships. ISOs with software-enabled relationships (POS platform, recurring SaaS tools) typically see 8-12% churn. The difference is switching costs — a merchant running their operations on your software platform is far stickier than one who only uses you for processing.
How much should an ISO invest in customer success and retention?
A well-designed customer success program typically costs 5-10% of portfolio revenue — for example, $30,000-$60,000/year for a $500,000 processing book. At that investment level, ISOs typically reduce churn by 8-12 percentage points (from 20% to 8-12%), generating net savings of $100,000-$200,000 on a $500,000 book. The ROI is usually 200-400%.
What are the highest-ROI retention tactics?
Quarterly business reviews (QBRs) consistently generate the highest ROI — they cost only your time but create relationship depth that prevents switching. Proactive outreach on warning signs (declining volume, rising chargebacks) catches at-risk merchants before competitors do. Annual contract reviews at the 11-month mark prevent passive renewal failures. And software platform ownership — having your technology running the merchant’s daily operations — is the most powerful retention tool available.
How does software ownership change the retention calculus?
Software-enabled relationships generate 90%+ annual retention because switching costs are real and structural. A merchant running orders, tables, inventory, and reporting on your POS platform cannot easily replace you — they’d need to retrain staff, reconfigure integrations, and rebuild operational workflows. Processing-only relationships have no equivalent friction, which is why they churn at 15-25% per year. ISOs who want predictable residual income growth should prioritize software ownership as their primary retention strategy.
The true cost of merchant churn is 3-5x what most ISOs calculate — and that changes everything about how you should invest in retention. A customer success program costing 5-10% of portfolio revenue typically reduces churn from 20% to 8-10%, generating 200-400% net ROI. The highest-leverage tactics are quarterly business reviews, proactive outreach on warning signs, and — most importantly — owning the software platform your merchants run their operations on. Software creates the switching costs that make 90%+ annual retention achievable, while processing-only relationships structurally churn at 15-25%. OrderPin is a restaurant POS software ISV whose white-label platform creates the kind of deep operational integration that drives retention from 80% to 95%+, helping ISOs build predictable, compounding residual income instead of constantly rebuilding their merchant base.
About OrderPin
OrderPin is a white-label POS platform built for ISO and MSP partners. We offer full data ownership, flexible pricing, and seamless API integrations to help you build a recurring revenue business under your own brand. Learn more about OrderPin’s white-label solution