
TL;DR — Quick Summary
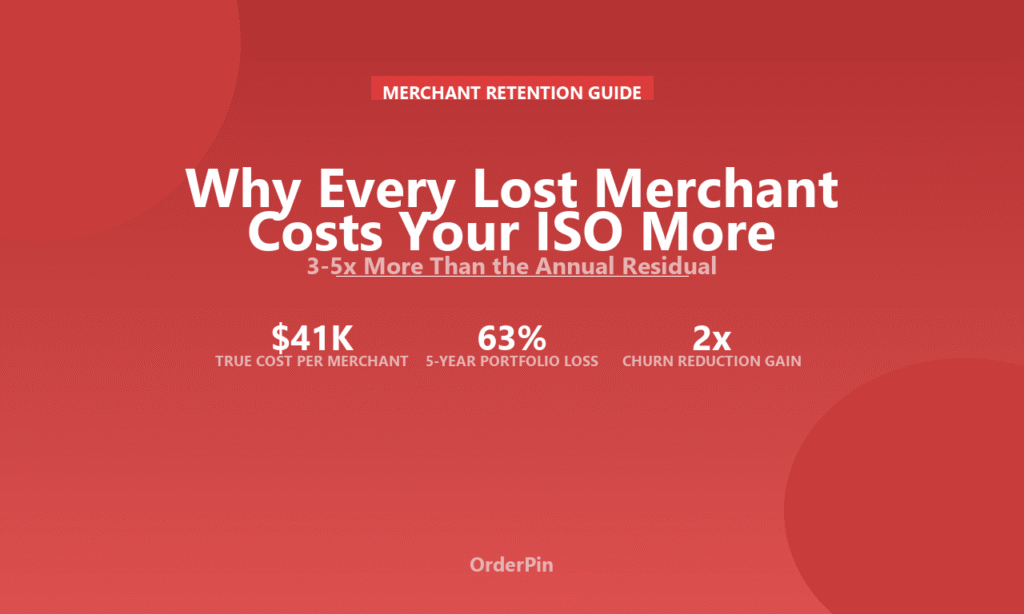
- Each lost merchant costs your ISO 3–5x the annual residual value when you factor in acquisition costs, lost SaaS revenue, portfolio valuation impact, and the compounding effect of attrition on growth.
- A portfolio with 12% annual churn loses 46% of its merchants over 5 years. At 18% churn (the current industry average), that jumps to 63% — meaning nearly two-thirds of your book turns over every 5 years.
- Reducing churn from 18% to 10% doubles the terminal value of your ISO portfolio at exit — and adds $300K+ in retained revenue over 5 years for a 500-merchant book.
Most ISOs think about churn in simple terms: “We lost 20 merchants this quarter, that’s about $3,000 a month in residuals gone.”
That calculation misses almost everything that matters. The true cost of a lost merchant extends far beyond the lost residual — and understanding it is the first step to building a retention-focused ISO operation.
1. The True Cost of a Lost Merchant: A Full Accounting
Consider a merchant generating $400/month in total revenue ($200 residuals + $200 SaaS fees). Here is what losing them actually costs:
| Cost Component | Annual Impact | Notes |
|---|---|---|
| Lost residual income | $4,800 | $200/month × 24 months avg tenure |
| Lost SaaS revenue (if applicable) | $4,800 | $200/month × 24 months |
| New merchant acquisition cost | $1,500–$3,000 | Sales & marketing to replace them |
| Portfolio valuation impact | $7,200–$14,400 | Lost ARR × 3–6x multiple |
| Compound growth effect | $15,000+ | Lost referrals, data, cross-sell potential |
The true cost of losing one $400/month merchant: $33,300–$41,200 over 5 years
2. The Compounding Effect: How Churn Eats Your Portfolio
A portfolio with 18% annual churn loses merchants on a compounding curve. Here is what 500 merchants look like over 5 years at different churn rates:
| Year | 18% Churn (Remaining) | 12% Churn (Remaining) | 5% Churn (Remaining) |
|---|---|---|---|
| Start | 500 | 500 | 500 |
| Year 1 | 410 | 440 | 475 |
| Year 2 | 336 | 387 | 451 |
| Year 3 | 276 | 341 | 429 |
| Year 4 | 226 | 300 | 407 |
| Year 5 | 185 | 264 | 387 |
At 18% churn, you lose 63% of your portfolio in 5 years without new sales. At 5% churn, you retain 77%. The difference over 5 years: 202 merchants — worth $80K–$100K per year in lost revenue.
3. Why Merchants Leave: The Root Causes
| Reason for Leaving | % of Churn | Retention Strategy |
|---|---|---|
| Found a better rate | 38% | Bundle software to make rate comparison irrelevant |
| Poor customer service | 22% | Proactive check-ins, dedicated account rep |
| Business closed/sold | 18% | Build relationship with new owner |
| Switched to POS platform | 14% | Offer your own POS solution |
| Other | 8% | Exit interview to identify gaps |
Source: TSG 2025 ISO Attrition Study. Note that 52% of churn is preventable through software bundling and service improvements.
4. The Retention ROI Calculator
Here is how investing in retention pays off for a 500-merchant ISO with average revenue of $400/merchant/month:
| Metric | Current (18% Churn) | Improved (10% Churn) |
|---|---|---|
| 5-year revenue (retained only) | $3.6M | $5.1M |
| Replacement cost (new sales) | $450K | $250K |
| Portfolio ARR at year 5 | $888K | $1.27M |
| Estimated exit value (ARR × 3x) | $2.66M | $3.81M |
5. Six Retention Strategies That Actually Work
- Bundle software immediately — Merchants using 3+ software layers have 5% annual churn vs 18% for payment-only
- Quarterly business reviews — 15-minute check-ins to review processing data and identify needs before merchants shop
- Early warning system — Monitor processing volume drops >20% as a churn signal and proactively re-engage
- Exit interviews — Every lost merchant gets a call to identify the real reason and fix systemic issues
- Loyalty program upsell — A loyalty program reduces merchant churn by 40%+ while generating additional SaaS revenue
- Referral program — Happy merchants are your best acquisition channel. Offer $500 credit per referral
Bottom Line
Merchant churn is the single biggest drag on ISO portfolio value — and the most under-addressed. Most ISOs spend 80% of their energy on new acquisition and 20% on retention, when the ratio should be reversed.
Every percentage point of churn reduction adds tens of thousands of dollars in retained revenue and hundreds of thousands in portfolio valuation. The ISOs who master retention will not just survive the margin compression era — they will exit rich.
Data sources: The Strawhecker Group (TSG) 2025 ISO Attrition Study, Bond Brand Loyalty Report 2025, TSG ISO Performance Benchmarks 2025–2026. Figures reflect U.S. market.