
TL;DR — Quick Summary
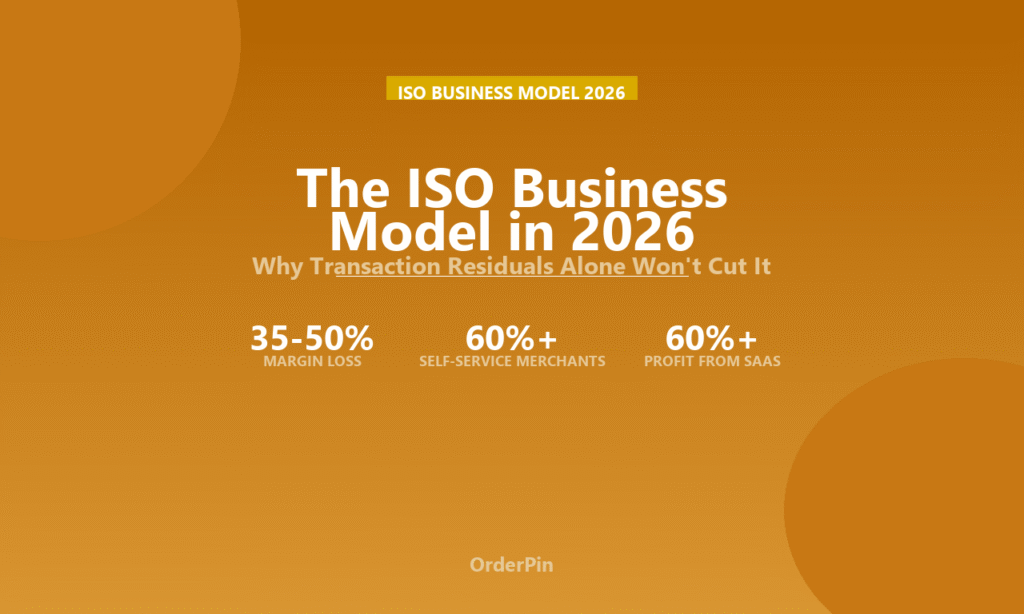
- The traditional ISO model — selling processing at razor-thin margins and living on residuals — is structurally declining. Rate compression has cut effective margins by 35–50% since 2020.
- Merchant attrition is accelerating as self-service platforms (Square, Toast, Lightspeed) absorb 60%+ of new merchant signups. ISOs using the old model are losing relevance, not just revenue.
- The surviving ISO model in 2026 is built on three revenue pillars: payment processing, SaaS subscriptions, and embedded financial services — with the latter two generating 60%+ of profit.
The traditional ISO business model looks increasingly like a relic from a different era. Sell a terminal, lock in processing, collect residuals, repeat. It was a good run, but the economics are breaking.
This isn’t a prediction about the distant future. It’s happening now. Here is the data on why the old ISO model is fading and what the winning model looks like in 2026.
1. Five Forces Killing the Traditional ISO Model
| Force | Impact on Traditional ISO | Timeline |
|---|---|---|
| Interchange-plus pricing transparency | Margins compressed from 0.5% to 0.1–0.2% | Already happening |
| Self-service platforms (Square, Toast) | 60% of merchants < $500K/year sign up without ISO | Accelerating |
| Rate comparison tools | Merchants switch on price alone — churn up 40% | Already happening |
| POS platforms becoming processing gateways | POS owner controls the merchant, not the ISO | Accelerating |
| Regulatory pressure on interchange fees | Durbin 2.0 could cut debit fees 60%+ | Potential 2026–2027 |
2. The Math of Decline: A Real Example
Consider a traditional ISO with 500 merchants averaging $20,000/month in processing volume:
| Metric | 2020 | 2026 |
|---|---|---|
| Monthly volume | $10M | $10M |
| Effective margin | 0.45% | 0.20% |
| Monthly residual income | $45,000 | $20,000 |
| Annual attrition | 12% | 18% |
| Effective annual residency | $540,000 | $196,800 |
That is a 64% decline in effective residual income with the same processing volume. Rate compression and churn have cut the heart out of the traditional model.
3. The Three-Pillar ISO Model
Pillar 1: Payment Processing (30% of profit, down from 80%)
Processing still matters — it’s the entry point to the merchant relationship. But it’s no longer the profit center. Price processing competitively, use it to get in the door, and make your money elsewhere.
Pillar 2: SaaS Subscriptions (40% of profit)
POS software, online ordering, loyalty programs, employee scheduling, and analytics. Each layer adds $30–$150/month per merchant at 70–85% gross margins. A 500-merchant ISO can build $150K–$500K+ in annual SaaS revenue.
Pillar 3: Embedded Financial Services (30% of profit)
Working capital advances, merchant cash advances, insurance cross-sells, payroll processing, and BNPL at the point of sale. Embedded finance generates 10–30% of processing volume in incremental fee income.
4. Revenue Comparison: Old Model vs Three-Pillar Model
| Revenue Stream | Old Model (500 merchants) | Three-Pillar (500 merchants) |
|---|---|---|
| Processing residuals (net) | $240K/yr | $120K/yr |
| SaaS subscriptions | $0 | $300K/yr |
| Embedded finance (rev share) | $0 | $180K/yr |
| Total annual revenue | $240K | $600K |
Key Insight
The three-pillar model generates 2.5x more revenue from the same number of merchants. Even if you cut processing margins in half (to compete with self-service platforms), the SaaS and embedded finance pillars more than compensate.
5. Transitioning Your ISO: A Practical 90-Day Plan
Bottom Line
The traditional ISO model of selling processing at slim margins and living on residuals is structurally declining. Rate compression, self-service platforms, and merchant churn have cut effective income by 64% in six years for the average portfolio.
The winning model in 2026 has three pillars — processing as the entry point, SaaS subscriptions as the profit engine, and embedded finance as the growth accelerator. ISOs who make this transition will build portfolios worth 3–5x ARR. Those who don’t will watch their books shrink year after year.
Data sources: The Strawhecker Group (TSG) ISO Performance Benchmarks 2025–2026, Nilson Report Processing Margin Analysis Q1 2026, McKinsey SMB Payments Study 2025, Federal Reserve Payments Study 2025. All figures reflect U.S. market.