
TL;DR — Quick Summary
- Most ISOs model per-merchant unit economics but never model their own business-level TCO: the total cost of running a white label POS business includes vendor platform fees (per-merchant and per-location), support staff salary and overhead, infrastructure (domain, SSL, developer accounts), payment processing reserves and risk, chargeback liability, training and onboarding time, and opportunity cost of capital tied up in hardware and reserves. Without a TCO model, the ISO cannot answer the most important business question: at what merchant count and volume does this business become profitable?
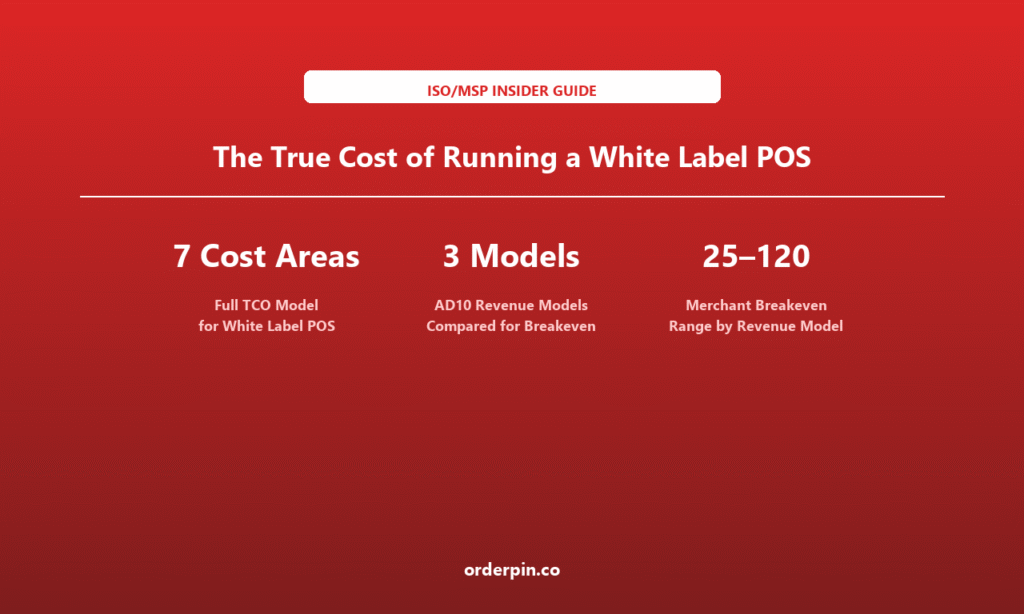
- The TCO calculator in this article breaks costs into seven categories and maps them against the three revenue models from AD10: Margin Stack (pure processing margin), Bundle (software + processing margin), and Hybrid (processing + SaaS + value-added services). The breakeven point varies by model: Margin Stack breakeven at approximately 80 to 120 merchants, Bundle at 40 to 70 merchants, and Hybrid at 25 to 50 merchants, depending on average processing volume and software attachment rate.
- The biggest hidden cost is support staff: most ISOs underestimate support burden by 40 to 60 percent because they model it as a fractional cost during onboarding, not as a dedicated function once the portfolio exceeds 50 merchants. A white label POS business with 100 active merchants typically needs 0.5 to 1.0 FTE support staff — and if that role is not staffed, the ISO absorbs the cost in churned merchants, not in salary line items.
for White Label POS
Compared for Breakeven
Range by Revenue Model
Why Per-Merchant Margin Is Not Enough
The ISO calculates per-merchant margin: processing volume times basis points, minus the vendor’s per-merchant fee, equals net margin per merchant. Multiply by merchant count, and you have portfolio revenue. This is the calculation most ISOs run before signing with a white label platform — and it is the calculation that makes the business look profitable at 20 merchants when the TCO model says breakeven is at 80.
The gap between per-merchant margin and business-level TCO is the cost of running the business itself: the support staff who answer merchant calls, the infrastructure that keeps your white-labeled portal online, the processing reserves that tie up your capital, the chargeback liability that hits when a merchant fails, and the training time that every new merchant and every new staff member requires. These costs do not appear in the vendor’s pricing sheet — they appear in your P&L, and they determine whether your white label POS business is a profitable business or a break-even hobby.
+ volume-based fees
0.5–1.0 FTE at 100 merchants
chargeback liability
hardware & reserves
The Seven Cost Categories
The TCO model breaks the white label POS business cost into seven categories. Each category has a fixed component (cost that does not scale with merchant count) and a variable component (cost that scales per merchant or per location). The ISO should calculate both components for each category, then sum to get the total monthly cost of running the business at the current portfolio size.
1. Vendor Platform Fees
The most visible cost category and the one most ISOs model correctly. Includes per-merchant platform fees (typically $15 to $50 per merchant per month depending on the vendor and tier), per-location fees for multi-location merchants ($5 to $25 per additional location), volume-based fees (a basis-point surcharge on processing volume, typically 5 to 15 bps above interchange), and any minimum monthly volume commitments (some vendors require $2,000 to $5,000 in monthly fees or charge the difference). This is the cost the vendor discloses in the contract — it is the floor, not the ceiling.
2. Support Staff
The largest hidden cost and the one most frequently underestimated. A white label POS portfolio generates support tickets in three categories: configuration issues (merchant changed a menu item and something broke, typically 30 to 40 percent of tickets), training gaps (staff turnover means new employees who do not know the system, 25 to 35 percent), and platform or hardware issues (terminal failure, network connectivity, payment decline, 20 to 30 percent). At 50 merchants, support burden is typically 1 to 3 tickets per merchant per month, averaging 15 minutes per ticket — which is 25 to 40 hours per month, a fractional role. At 100 merchants, it is 50 to 80 hours per month, which is a half to full FTE. At 200 merchants, it is 100 to 160 hours, which is one to two FTEs. The ISO that does not staff this role absorbs the cost in churned merchants who leave because their support experience is poor.
3. Infrastructure
The cost of keeping your white-labeled business online and branded. Includes custom domain registration and renewal ($10 to $50 per year), SSL certificate management ($0 to $200 per year depending on whether the vendor provides it or you self-manage), Apple Developer Program account ($99 per year) and Google Play developer account ($25 one-time) for app store listings, email infrastructure for your branded support address (G Suite or Microsoft 365, $6 to $12 per user per month), and any reverse proxy or CDN costs if you self-host the white-label layer ($20 to $100 per month). This is a low-cost category but it is fully fixed — it does not decrease per merchant as you scale.
4. Payment Processing Reserves
Capital tied up in processing reserves — the funds the processor holds back to cover potential chargebacks and merchant defaults. Reserve structures vary: rolling reserves (5 to 10 percent of daily volume held for 90 to 180 days, then released), fixed reserves ($5,000 to $25,000 upfront deposit), or capped reserves (reserve builds up to a cap, then stops). For a portfolio processing $1 million per month, a 5 percent rolling reserve with a 90-day release means $50,000 is tied up at any given time — capital that cannot be deployed elsewhere. This is an opportunity cost, not an expense, but it reduces the effective return on capital.
5. Chargeback and Risk Liability
When a merchant’s customer disputes a charge and the merchant cannot cover the chargeback (because they closed, went bankrupt, or the transaction was fraudulent), the liability falls to the ISO. Average chargeback rates range from 0.05 percent (low-risk retail) to 1.5 percent (high-risk e-commerce). For a portfolio of 100 merchants processing an average of $20,000 per month each ($2 million total monthly volume), a 0.3 percent chargeback rate with a 15 percent merchant default rate on chargebacks means approximately $900 per month in uncovered chargeback liability. This cost is unpredictable and lumpy — a single merchant failure can create a $5,000 to $20,000 chargeback event.
6. Training and Onboarding Time
The ISO’s time cost for each new merchant onboarding — the hours spent on pre-launch configuration, launch day presence, and 7-day stabilization follow-up. Based on the AD14 onboarding playbook, a thorough onboarding takes 8 to 15 hours of ISO time per merchant. At an internal cost of $50 to $100 per hour (fully loaded ISO staff cost), that is $400 to $1,500 per new merchant in onboarding labor alone. This cost is variable — it scales with new merchant acquisition rate, not with portfolio size — but it is real and it hits cash flow before the merchant’s first month of processing revenue arrives.
7. Opportunity Cost of Capital
The return the ISO’s capital could have earned if deployed elsewhere — in a different business line, in marketable securities, or in an alternative investment. For a white label POS business with $50,000 tied up in reserves, $20,000 in hardware deployed to merchants, and $10,000 in working capital, the opportunity cost at a 7 percent alternative return is approximately $5,600 per year. This is the cost of choosing this business over the next-best alternative — and it should be included in the TCO model to ensure the business is not merely profitable on paper but also competitive with alternative uses of capital.
TCO Calculator: Monthly Cost at 100 Merchants
The table below models the monthly TCO for a white label POS business with 100 active merchants, average processing volume of $20,000 per merchant per month ($2 million portfolio volume), and the Bundle revenue model (software + processing margin). Adjust the assumptions for your own portfolio.
| Cost Category | Fixed ($/mo) | Variable ($/mo) | Total ($/mo) | % of TCO |
|---|---|---|---|---|
| 1. Vendor platform fees | $500 | $2,500 | $3,000 | 22% |
| 2. Support staff (0.75 FTE) | $3,500 | $1,000 | $4,500 | 33% |
| 3. Infrastructure | $120 | $0 | $120 | 1% |
| 4. Processing reserves (opp. cost) | $0 | $580 | $580 | 4% |
| 5. Chargeback liability | $0 | $900 | $900 | 7% |
| 6. Training/onboarding (5 new/mo) | $0 | $2,500 | $2,500 | 18% |
| 7. Opportunity cost of capital | $470 | $0 | $470 | 3% |
| Total Monthly TCO | $4,590 | $7,480 | $12,070 | 100% |
Assumptions: 100 merchants, $20K avg monthly volume per merchant ($2M portfolio), Bundle revenue model with $50/merchant software fee + 20 bps processing margin. Vendor platform fee $30/merchant + 10 bps volume surcharge. Support staff $4,500/mo (0.75 FTE at $60K fully loaded). Reserve 5% rolling at 90-day release. Chargeback 0.3% rate, 15% uncovered. Onboarding 10 hrs/merchant at $75/hr, 5 new merchants/mo. Capital $80K deployed at 7% alternative return.
Breakeven Analysis by Revenue Model
Using the AD10 revenue models, the breakeven merchant count varies significantly by how the ISO monetizes the portfolio. The three models below assume the same cost structure as the TCO table above, but with different revenue per merchant:
| Revenue Model | Rev/Merchant/Mo | Fixed Cost | Var Cost/Merchant | Breakeven |
|---|---|---|---|---|
| Margin Stack (processing only) | $80 | $4,590 | $75 | ~120 merchants |
| Bundle (software + processing) | $170 | $4,590 | $75 | ~50 merchants |
| Hybrid (processing + SaaS + VAS) | $280 | $4,590 | $75 | ~27 merchants |
Breakeven formula: Fixed Cost / (Revenue per Merchant – Variable Cost per Merchant). The Hybrid model reaches breakeven fastest because it stacks three revenue streams on the same merchant base. The Margin Stack model requires the most merchants because it has the lowest revenue per merchant and the same variable cost structure. This is the economic argument for software attachment — every ISO should know which model they are running and what their breakeven merchant count is.
How OrderPin Fits the TCO Model
OrderPin is a white-label POS platform built for ISO and MSP partners. On the TCO model: OrderPin’s platform fee structure is transparent and scales with merchant count — no hidden volume surcharges or minimum monthly commitments that inflate the variable cost per merchant. The white-label configuration (custom domain, app store, receipts, support identity) is included in the platform fee, keeping the infrastructure cost category low. Use the TCO calculator above with OrderPin’s actual fee structure to model your breakeven merchant count — and compare it against every other platform on your shortlist using the same framework.
Frequently Asked Questions
How is TCO different from per-merchant unit economics?
Per-merchant unit economics (covered in AD4) looks at the margin on a single merchant: revenue minus direct costs. TCO looks at the entire business: the sum of all fixed and variable costs across the portfolio, including costs that do not appear in any single merchant’s P&L — like support staff salary, infrastructure, and opportunity cost of capital. Per-merchant unit economics tells you whether each merchant is profitable; TCO tells you whether the business is profitable. Both are necessary; neither is sufficient alone.
When should I hire a dedicated support person?
The trigger point is 50 to 70 active merchants. Below 50, support burden is typically 15 to 25 hours per month — manageable as a fractional responsibility. At 50 to 70, it crosses 30 to 40 hours — a half-time role. At 100, it is 50 to 80 hours — a full-time role. The mistake most ISOs make is waiting until support is clearly broken (ticket backlog, merchant complaints, churn) before hiring. The right time to hire is when the fractional model starts to strain — at 50 merchants — not when it has already failed at 100.
How do processing reserves affect my cash flow?
A rolling reserve of 5 percent on $2 million monthly volume means $100,000 is held at any given time (assuming 90-day release). That is $100,000 you cannot use for payroll, marketing, or growth investment — it is tied up until the release cycle catches up. The reserve builds during your growth phase (because new volume adds to the reserve faster than old volume releases) and stabilizes once growth slows. Factor the reserve growth into your cash flow forecast — it is a use of cash that does not appear on the P&L but appears on the balance sheet.
What is the biggest TCO mistake ISOs make?
Modeling vendor platform fees as the total cost — and ignoring support staff, reserves, and chargeback liability. The vendor fee is typically 20 to 25 percent of the true TCO. Support staff is 30 to 35 percent. Reserves and chargebacks together are 10 to 15 percent. Training and onboarding are 15 to 20 percent. The ISO that models only vendor fees will conclude the business is profitable at 20 merchants, when the TCO model says breakeven is at 50 to 120 depending on the revenue model.
Should I include marketing and customer acquisition cost in TCO?
CAC is a separate metric from TCO. TCO measures the cost of running the business for the existing portfolio; CAC measures the cost of adding new merchants to it. Both should be modeled, but separately: TCO tells you whether the business is profitable at its current size, and CAC tells you whether growth is affordable. The combination — TCO per merchant plus CAC per merchant, compared against lifetime value (LTV) — gives you the full unit economics picture. See AD4 for the per-merchant LTV model.
How does the Hybrid model reach breakeven at only 27 merchants?
The Hybrid model stacks three revenue streams: processing margin (20 bps on $20K = $40/merchant), SaaS software fee ($50/merchant), and value-added services like loyalty, gift cards, or analytics ($190/merchant average, based on 40 percent attachment rate at $475 per attached merchant). Total revenue per merchant is $280, against $75 variable cost per merchant — a contribution margin of $205. Fixed costs of $4,590 divided by $205 gives breakeven at approximately 22 to 27 merchants. The Hybrid model is the most capital-efficient way to run a white label POS business, but it requires the ISO to actively sell and support value-added services — not just process transactions.
Per-merchant margin is not enough to know whether your white label POS business is profitable — you need a TCO model that captures all seven cost categories, from vendor platform fees to opportunity cost of capital. The TCO calculator in this article gives you the framework: model your fixed and variable costs, map them against your AD10 revenue model, and calculate your breakeven merchant count. The biggest hidden cost is support staff — 30 to 35 percent of TCO — and the biggest strategic lever is revenue model selection: the Hybrid model reaches breakeven at 27 merchants, while the Margin Stack model needs 120. Run the numbers for OrderPin, a white-label POS platform built for ISO and MSP partners, and use the TCO framework to compare every platform on your shortlist against the same cost structure.
About OrderPin
OrderPin is a white-label POS platform built for ISO and MSP partners. We offer full data ownership, flexible pricing, and seamless API integrations to help you build a recurring revenue business under your own brand. Learn more about OrderPin’s white-label solution